本文為英文版的機器翻譯版本,如內容有任何歧義或不一致之處,概以英文版為準。
遷移至 OpenTelemetry Ruby
若要將 Ruby 應用程式從 X-Ray SDK 遷移至 OpenTelemetry 檢測,請使用下列程式碼範例和手動檢測的指引。
使用 SDK 手動檢測您的解決方案
- Tracing setup with X-Ray SDK
-
適用於 Ruby 的 X-Ray 開發套件需要您使用服務外掛程式來設定程式碼。
require 'aws-xray-sdk' XRay.recorder.configure(plugins: [:ec2, :elastic_beanstalk]) - Tracing setup with OpenTelemetry SDK
-
注意
目前無法為 OpenTelemetry Ruby 設定 X-Ray 遠端取樣。
對於 Ruby on Rails 應用程式,請將您的組態程式碼放在 Rails 初始化器中。如需詳細資訊,請參閱 入門
。對於所有手動檢測的 Ruby 程式,您必須使用 OpenTelemetry::SDK.configure方法來設定 OpenTelemetry Ruby SDK。首先,安裝下列套件:
bundle add opentelemetry-sdk opentelemetry-exporter-otlp opentelemetry-propagator-xray接著,透過程式初始化時執行的組態程式碼來設定 OpenTelemetry SDK。建議您設定下列元件:
-
OTLP Exporter– 將追蹤匯出至 CloudWatch 代理程式和 OpenTelemetry 收集器時需要 -
An AWS X-Ray Propagator– 將追蹤內容傳播至與 X-Ray 整合 AWS 的服務時需要
require 'opentelemetry-sdk'
require 'opentelemetry-exporter-otlp'

# Import the gem containing the AWS X-Ray for OTel Ruby ID Generator and propagator
require 'opentelemetry-propagator-xray'

OpenTelemetry::SDK.configure do |c|
  c.service_name = 'my-service-name'

  c.add_span_processor(
    # Use the BatchSpanProcessor to send traces in groups instead of one at a time
    OpenTelemetry::SDK::Trace::Export::BatchSpanProcessor.new(
      # Use the default OLTP Exporter to send traces to the ADOT Collector
      OpenTelemetry::Exporter::OTLP::Exporter.new(
        # The OpenTelemetry Collector is running as a sidecar and listening on port 4318
        endpoint:"http://127.0.0.1:4318/v1/traces"
      )
    )
  )

  # The X-Ray Propagator injects the X-Ray Tracing Header into downstream calls
  c.propagators = [OpenTelemetry::Propagator::XRay::TextMapPropagator.new]
end
OpenTelemetry SDKs也有程式庫檢測的概念。啟用這些項目會自動建立 AWS SDK 等程式庫的跨度。OpenTelemetry 提供啟用所有程式庫檢測的選項,或指定要啟用哪些程式庫檢測。
若要啟用所有檢測,請先安裝
opentelemetry-instrumentation-all套件:bundle add opentelemetry-instrumentation-all接著,更新組態以啟用所有程式庫檢測,如下所示:
require 'opentelemetry/instrumentation/all'
...

OpenTelemetry::SDK.configure do |c|
   ...

  c.use_all() # Enable all instrumentations
end
OpenTelemetry SDKs也有程式庫檢測的概念。啟用這些項目會自動建立 AWS SDK 等程式庫的跨度。OpenTelemetry 提供啟用所有程式庫檢測的選項,或指定要啟用哪些程式庫檢測。
若要啟用所有檢測,請先安裝
opentelemetry-instrumentation-all套件:bundle add opentelemetry-instrumentation-all接著,更新組態以啟用所有程式庫檢測,如下所示:
require 'opentelemetry/instrumentation/all' ... OpenTelemetry::SDK.configure do |c| ... c.use_all() # Enable all instrumentations end -
追蹤傳入的請求 (Rails 檢測)
- With X-Ray SDK
-
使用 X-Ray 開發套件時,會在初始化時為 Rails 架構設定 X-Ray 追蹤。
範例 – config/initializers/aws_xray.rb
Rails.application.config.xray = { name: 'my app', patch: %I[net_http aws_sdk], active_record: true } - With OpenTelemetry SDK
首先,安裝下列套件:
bundle add opentelemetry-instrumentation-rack opentelemetry-instrumentation-rails opentelemetry-instrumentation-action_pack opentelemetry-instrumentation-active_record opentelemetry-instrumentation-action_view接著,更新組態以啟用 Rails 應用程式的檢測,如下所示:
# During SDK configuration
OpenTelemetry::SDK.configure do |c|

  ...

  c.use 'OpenTelemetry::Instrumentation::Rails'
  c.use 'OpenTelemetry::Instrumentation::Rack'
  c.use 'OpenTelemetry::Instrumentation::ActionPack'
  c.use 'OpenTelemetry::Instrumentation::ActiveSupport'
  c.use 'OpenTelemetry::Instrumentation::ActionView'

  ...

end
AWS SDK 檢測
- With X-Ray SDK
-
若要檢測來自 AWS SDK 的傳出 AWS 請求, AWS 開發套件用戶端會使用 X-Ray 進行修補,如下列範例所示:
require 'aws-xray-sdk' require 'aws-sdk-s3' # Patch AWS SDK clients XRay.recorder.configure(plugins: [:aws_sdk]) # Use the instrumented client s3 = Aws::S3::Client.new s3.list_buckets - With OpenTelemetry SDK
AWS 適用於 Ruby V3 的 SDK 支援記錄和發出 OpenTelemetry 追蹤。如需如何為服務用戶端設定 OpenTelemetry 的資訊,請參閱《適用於 Ruby 的 AWS SDK》中的設定可觀測性功能。
檢測傳出的 HTTP 呼叫
對外部服務進行 HTTP 呼叫時,如果自動檢測不可用或無法提供足夠的詳細資訊,您可能需要手動檢測呼叫。
- With X-Ray SDK
-
為了檢測下游呼叫,X-Ray SDK for Ruby 用於修補您的應用程式使用的
net/http程式庫:require 'aws-xray-sdk' config = { name: 'my app', patch: %I[net_http] } XRay.recorder.configure(config) - With OpenTelemetry SDK
若要使用 OpenTelemetry 啟用
net/http檢測,請先安裝opentelemetry-instrumentation-net_http套件:bundle add opentelemetry-instrumentation-net_http接著,更新組態以啟用
net/http檢測,如下所示:OpenTelemetry::SDK.configure do |c| ... c.use 'OpenTelemetry::Instrumentation::Net::HTTP' ... end
其他程式庫的檢測支援
您可以在 opentelemetry-ruby-contrib
或者,您可以搜尋 OpenTelemetry 登錄檔,了解 OpenTelemetry 是否支援檢測。如需詳細資訊,請參閱 登錄
手動建立追蹤資料
- With X-Ray SDK
-
使用 X-Ray,
aws-xray-sdk套件會要求您手動建立區段及其子區段,以追蹤您的應用程式。您也可以將 X-Ray 註釋和中繼資料新增至您的區段或子區段:require 'aws-xray-sdk' ... # Start a segment segment = XRay.recorder.begin_segment('my-service') # Add annotations (indexed key-value pairs) segment.annotations[:user_id] = 'user-123' segment.annotations[:payment_status] = 'completed' # Add metadata (non-indexed data) segment.metadata[:order] = { id: 'order-456', items: [ { product_id: 'prod-1', quantity: 2 }, { product_id: 'prod-2', quantity: 1 } ], total: 67.99 } # Add metadata to a specific namespace segment.metadata(namespace: 'payment') do |metadata| metadata[:transaction_id] = 'tx-789' metadata[:payment_method] = 'credit_card' end # Create a subsegment with annotations and metadata segment.subsegment('payment-processing') do |subsegment1| subsegment1.annotations[:payment_id] = 'pay-123' subsegment1.metadata[:details] = { amount: 67.99, currency: 'USD' } # Create a nested subsegment subsegment1.subsegment('operation-2') do |subsegment2| # Do more work... end end # Close the segment segment.close - With OpenTelemetry SDK
-
您可以使用自訂跨度來監控檢測程式庫未擷取的內部活動效能。請注意,只有種類的伺服器會轉換為 X-Ray 區段,所有其他範圍則會轉換為 X-Ray 子區段。根據預設,跨度為
INTERNAL。首先,建立追蹤器以產生跨度,您可以透過
OpenTelemetry.tracer_provider.tracer('<YOUR_TRACER_NAME>')方法取得。這將提供在您應用程式的 OpenTelemetry 組態中全域註冊的 Tracer 執行個體。在整個應用程式中具有單一追蹤器是很常見的。建立 OpenTelemetry 追蹤器並使用它來建立跨度:require 'opentelemetry-sdk' ... # Get a tracer tracer = OpenTelemetry.tracer_provider.tracer('my-application') # Create a server span (equivalent to X-Ray segment) tracer.in_span('my-application', kind: OpenTelemetry::Trace::SpanKind::SERVER) do |span| # Do work... # Create nested spans of default kind INTERNAL will become an X-Ray subsegment tracer.in_span('operation-1') do |child_span1| # Set attributes (equivalent to X-Ray annotations and metadata) child_span1.set_attribute('key', 'value') # Do more work... tracer.in_span('operation-2') do |child_span2| # Do more work... end end end使用 OpenTelemetry SDK 將註釋和中繼資料新增至追蹤
使用
set_attribute方法將屬性新增至每個範圍。請注意,根據預設,所有這些跨度屬性都會轉換為 X-Ray 原始資料中的中繼資料。若要確保屬性轉換為註釋而非中繼資料,您可以將該屬性索引鍵新增至aws.xray.annotations屬性清單。如需詳細資訊,請參閱啟用自訂 X-Ray 註釋。# SERVER span will become an X-Ray segment tracer.in_span('my-server-operation', kind: OpenTelemetry::Trace::SpanKind::SERVER) do |span| # Your server logic here span.set_attribute('attribute.key', 'attribute.value') span.set_attribute("metadataKey", "metadataValue") span.set_attribute("annotationKey1", "annotationValue") # Create X-Ray annotations span.set_attribute("aws.xray.annotations", ["annotationKey1"]) end
Lambda 手動檢測
- With X-Ray SDK
-
在 Lambda 上啟用主動追蹤之後,使用 X-Ray SDK 不需要其他組態。Lambda 將建立代表 Lambda 處理常式調用的區段,而且您可以使用 X-Ray SDK 建立子區段或檢測程式庫,而不需要任何額外的組態。
- With OpenTelemetry SDK
請考慮下列範例 Lambda 函數程式碼 (無需檢測):
require 'json'
def lambda_handler(event:, context:)
    # TODO implement
    { statusCode: 200, body: JSON.generate('Hello from Lambda!') }
end
若要手動檢測 Lambda,您需要:
為您的 Lambda 新增下列 Gem
gem 'opentelemetry-sdk'
gem 'opentelemetry-exporter-otlp'
gem 'opentelemetry-propagator-xray'
gem 'aws-distro-opentelemetry-exporter-xray-udp'
gem 'opentelemetry-instrumentation-aws_lambda'
gem 'opentelemetry-propagator-xray', '~> 0.24.0' # Requires version v0.24.0 or higher
在 Lambda 處理常式外部初始化 OpenTelemetry SDK。建議使用下列設定 OpenTelemetry SDK:
-
具有 X-Ray UDP 跨度匯出器的簡易跨度處理器,可將追蹤傳送至 Lambda 的 UDP X-Ray 端點
-
X-Ray Lambda 傳播器
-
service_name要設定為 Lambda 函數名稱的組態
-
在 Lambda 處理常式類別中,新增下列行來檢測 Lambda 處理常式:
  class Handler
        extend OpenTelemetry::Instrumentation::AwsLambda::Wrap
        ...

        instrument_handler :process
    end
下列程式碼示範必要的變更之後的 Lambda 函數。您可以建立額外的自訂範圍,以補充自動提供的範圍。
require 'json'
require 'opentelemetry-sdk'
require 'aws/distro/opentelemetry/exporter/xray/udp'
require 'opentelemetry/propagator/xray'
require 'opentelemetry/instrumentation/aws_lambda'

# Initialize OpenTelemetry SDK outside handler
OpenTelemetry::SDK.configure do |c|
  # Configure the AWS Distro for OpenTelemetry X-Ray Lambda exporter
  c.add_span_processor(
    OpenTelemetry::SDK::Trace::Export::SimpleSpanProcessor.new(
      AWS::Distro::OpenTelemetry::Exporter::XRay::UDP::AWSXRayUDPSpanExporter.new
    )
  )

  # Configure X-Ray Lambda propagator
  c.propagators = [OpenTelemetry::Propagator::XRay.lambda_text_map_propagator]

  # Set minimal resource information
  c.resource = OpenTelemetry::SDK::Resources::Resource.create({
    OpenTelemetry::SemanticConventions::Resource::SERVICE_NAME => ENV['AWS_LAMBDA_FUNCTION_NAME']
  })
  c.use 'OpenTelemetry::Instrumentation::AwsLambda'
end

module LambdaFunctions
  class Handler
    extend OpenTelemetry::Instrumentation::AwsLambda::Wrap
    def self.process(event:, context:)
      "Hello!"
    end
    instrument_handler :process
  end
end
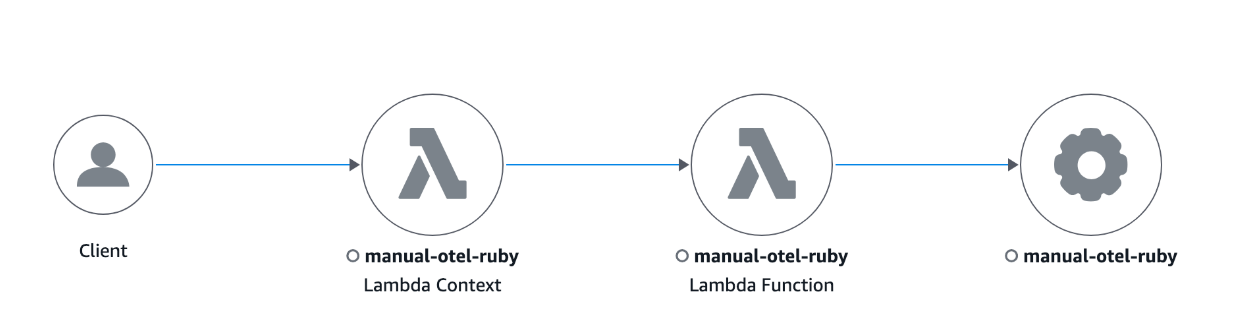
以下是以 Ruby 編寫之經檢測 Lambda 函數的範例追蹤映射。
您也可以使用 Lambda 層來設定 Lambda 的 OpenTelemetry。如需詳細資訊,請參閱 OpenTelemetry AWS-Lambda 檢測
