기계 번역으로 제공되는 번역입니다. 제공된 번역과 원본 영어의 내용이 상충하는 경우에는 영어 버전이 우선합니다.
MCP 서버 통합
솔루션 배포 중에 선택적 MCP 서버 구성 요소를 배포한 경우 분산 로드 테스트 솔루션을 모델 컨텍스트 프로토콜을 지원하는 AI 개발 도구와 통합할 수 있습니다. MCP 서버는 AI 어시스턴트를 통해 로드 테스트를 검색, 관리 및 분석할 수 있는 프로그래밍 방식의 액세스를 제공합니다.
고객은 선택한 클라이언트(Amazon Q, Claude 등)를 사용하여 DLT MCP 서버에 연결할 수 있으며, 각 클라이언트에는 약간 다른 구성 지침이 있습니다. 이 섹션에서는 MCP Inspector, Kiro CLI, Cline 및 Amazon Quick에 대한 설정 지침을 제공합니다.
1단계: MCP 엔드포인트 및 액세스 토큰 가져오기
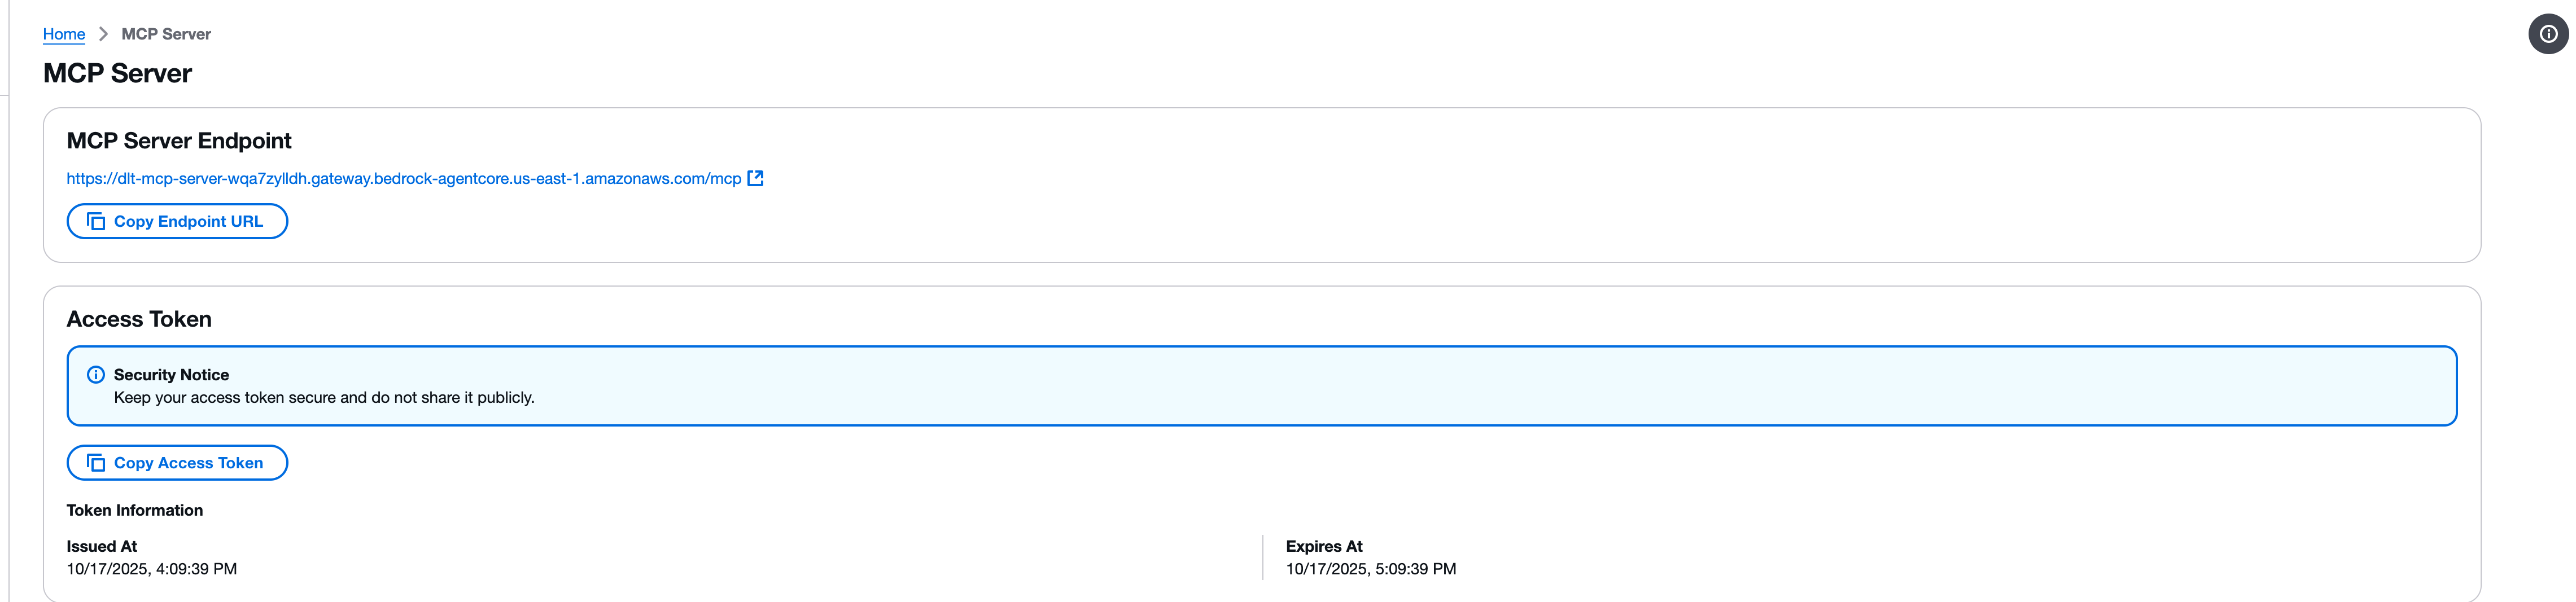
MCP 클라이언트를 구성하기 전에 DLT 웹 콘솔에서 MCP 서버 엔드포인트와 액세스 토큰을 검색해야 합니다.
-
분산 로드 테스트 웹 콘솔에서 MCP 서버 페이지로 이동합니다.
-
MCP 서버 엔드포인트 섹션을 찾습니다.
-
엔드포인트 URL 복사 버튼을 사용하여 엔드포인트 URL을 복사합니다. 엔드포인트 URL은 형식을 따릅니다.
https://{gateway-id}.gateway.bedrock-agentcore.{region}.amazonaws.com/mcp -
액세스 토큰 섹션을 찾습니다.
-
액세스 토큰 복사 버튼을 사용하여 액세스 토큰을 복사합니다.
중요
액세스 토큰을 안전하게 유지하고 공개적으로 공유하지 마십시오. 토큰은 MCP 인터페이스를 통해 분산 로드 테스트 솔루션에 대한 읽기 전용 액세스를 제공합니다.
2단계: MCP Inspector로 테스트
모델 컨텍스트 프로토콜은 MCP 서버에 직접 연결하고 도구를 호출하는 도구인 MCP Inspector
참고
MCP Inspector에는 버전 0.17 이상이 필요합니다. 모든 요청은 JSON RPC로 직접 수행할 수도 있지만 MCP Inspector는 보다 사용자 친화적인 인터페이스를 제공합니다.
MCP Inspector 설치 및 시작
-
필요한 경우 npm을 설치합니다.
-
다음 명령을 실행하여 MCP Inspector를 시작합니다.
npx @modelcontextprotocol/inspector
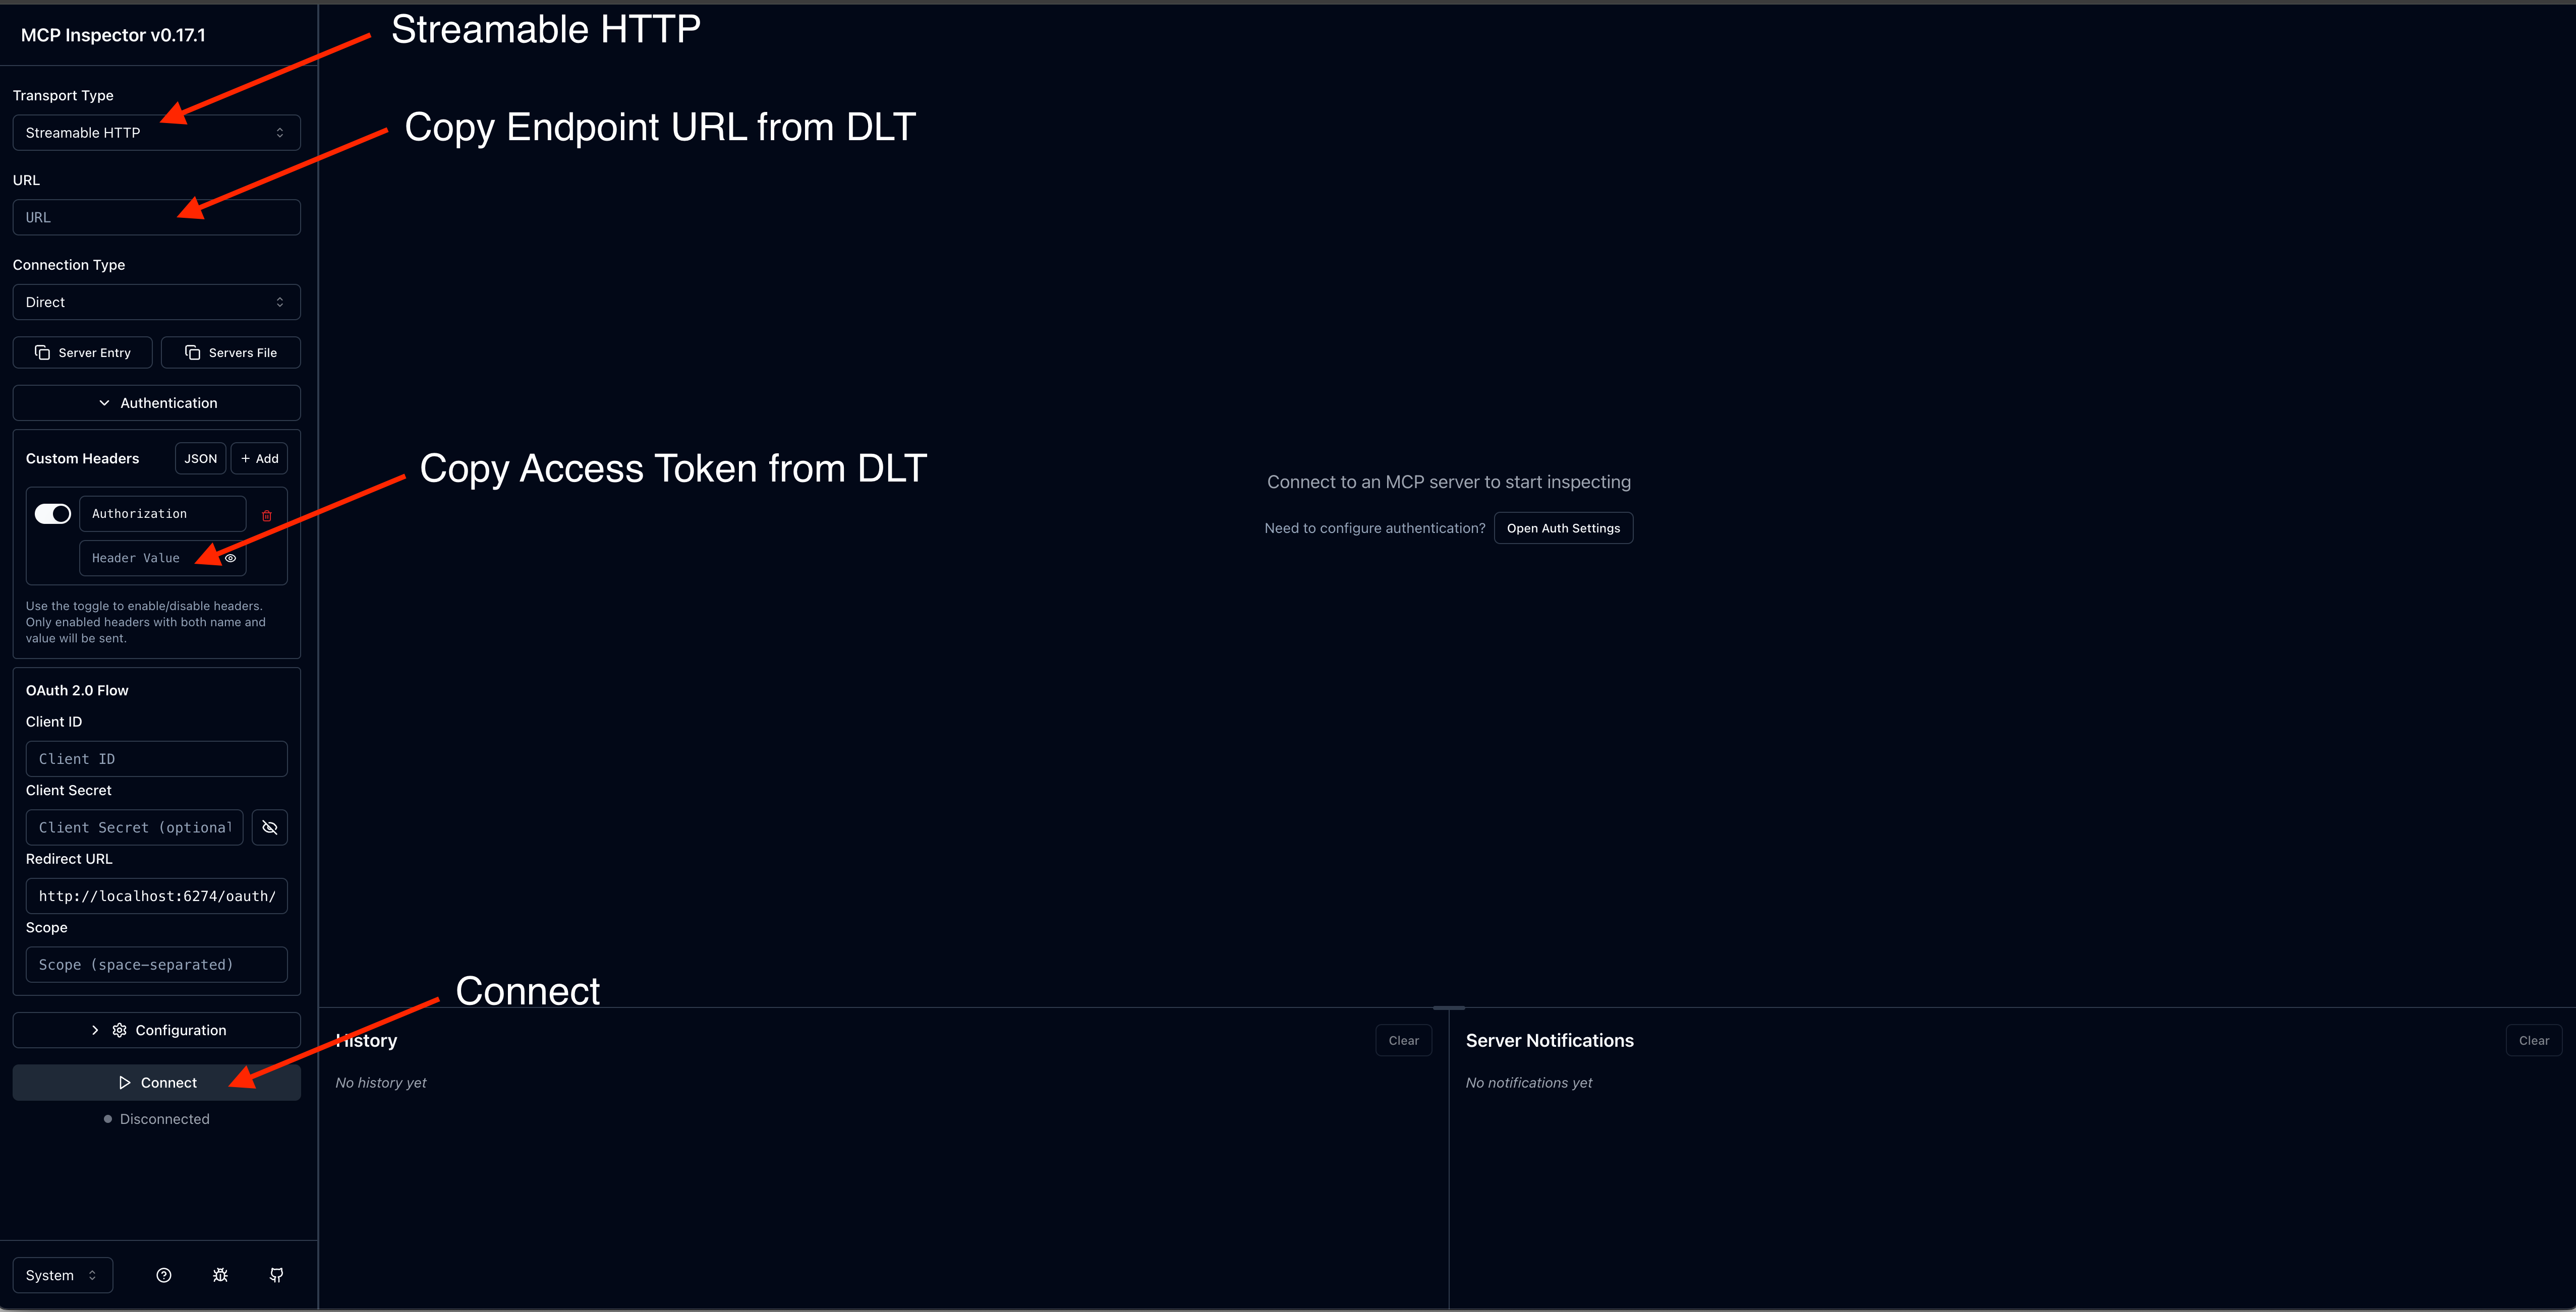
연결 구성
-
MCP Inspector 인터페이스에서 MCP 서버 엔드포인트 URL을 입력합니다.
-
액세스 토큰과 함께 권한 부여 헤더를 추가합니다.
-
연결을 선택하여 연결을 설정합니다.
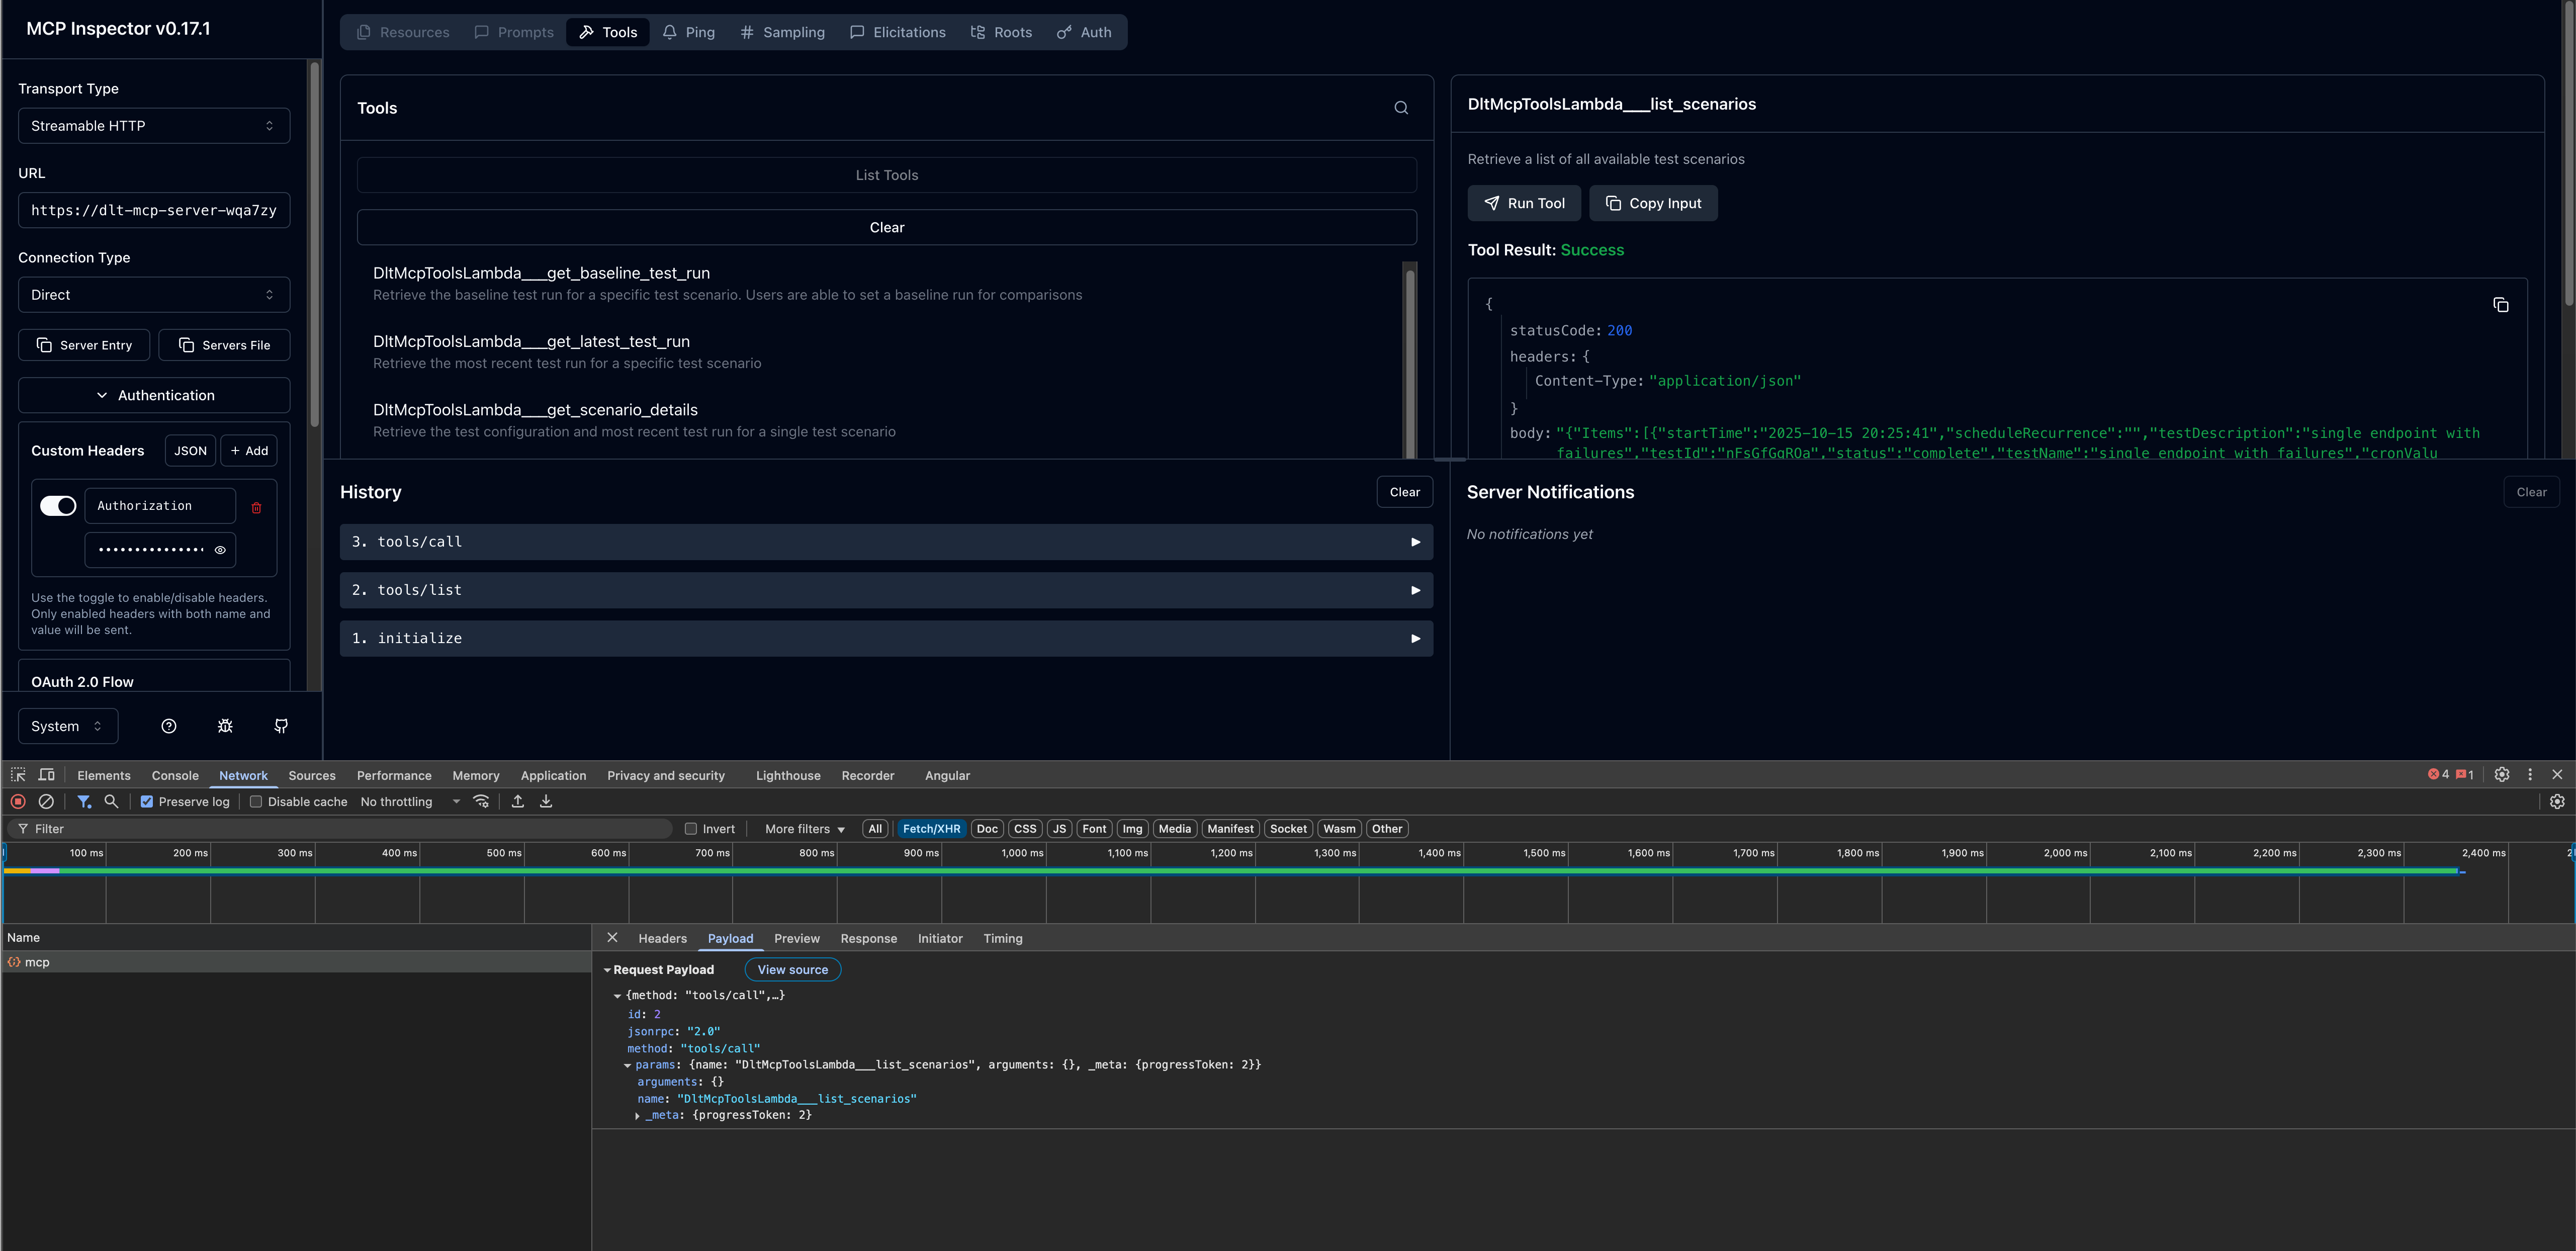
도구 호출
연결되면 사용 가능한 MCP 도구를 테스트할 수 있습니다.
-
왼쪽 패널에서 사용 가능한 도구 목록을 찾습니다.
-
도구를 선택합니다(예:
list_scenarios). -
필요한 파라미터를 입력합니다.
-
호출을 선택하여 도구를 실행하고 응답을 봅니다.
3단계: AI 개발 클라이언트 구성
MCP Inspector와의 MCP 서버 연결을 확인한 후 원하는 AI 개발 클라이언트를 구성할 수 있습니다.
Kiro CLI
Kiro CLI(이전 Amazon Q Developer CLI)는 MCP Server 통합을 통해 AI 지원 개발에 대한 명령줄 액세스를 제공합니다.
구성 단계
-
mcp.json구성 파일을 편집합니다. 구성 파일 위치에 대한 자세한 내용은 Kiro CLI 설명서의 모델 컨텍스트 프로토콜(MCP)을 참조하세요. -
DLT MCP 서버 구성을 추가합니다.
{
  "mcpServers": {
    "dlt-mcp": {
      "type": "http",
      "url": "https://<gateway-id>.gateway.bedrock-agentcore.<region>.amazonaws.com/mcp",
      "headers": {
        "Authorization": "Bearer <access-token>"
      }
    }
  }
}
<gateway-id> 및 <region>를 MCP 서버 엔드포인트 URL의 값으로 바꾸고 <access-token>를 1단계에서 복사한 값으로 바꿉니다.
구성 확인
-
터미널에서
kiro-cli를 입력하여 Kiro CLI를 시작합니다. -
사용 가능한 모든 MCP 서버를 보려면
/mcp를 입력합니다. -
dlt-mcp및 기타 구성된 MCP 서버에서 제공하는 사용 가능한 도구를 보려면/tools를 입력합니다. -
가
dlt-mcp성공적으로 초기화되는지 확인합니다.
클라인
Cline은 MCP Server 통합을 지원하는 AI 코딩 도우미입니다.
구성 단계
-
클라인에서 MCP 서버 관리 > 구성 > MCP 서버 구성으로 이동합니다.
-
cline_mcp_settings.json파일을 다음과 같이 업데이트 합니다.{ "mcpServers": { "dlt-mcp": { "type": "streamableHttp", "url": "https://<gateway-id>.gateway.bedrock-agentcore.<region>.amazonaws.com/mcp", "headers": { "Authorization": "Bearer <access-token>" } } } }<gateway-id>및<region>를 MCP 서버 엔드포인트 URL의 값으로 바꾸고<access-token>를 1단계에서 복사한 값으로 바꿉니다. -
구성 파일을 저장합니다.
-
Cline을 다시 시작하여 변경 사항을 적용합니다.
Amazon Quick
Amazon Quick(이전 Amazon Quick Suite)은 MCP Server 작업을 지원하는 포괄적인 AI 어시스턴트 플랫폼을 제공합니다.
사전 조건
Amazon Quick에서 MCP 서버를 구성하기 전에 DLT 배포의 Cognito 사용자 풀에서 OAuth 자격 증명을 검색해야 합니다.
-
AWS CloudFormation 콘솔
로 이동합니다. -
분산 로드 테스트 스택을 선택합니다.
-
출력 탭에서 DLT 배포와 연결된 Cognito 사용자 풀 ID를 찾아 복사합니다.
-
Amazon Cognito 콘솔
로 이동합니다. -
CloudFormation 출력에서 사용자 풀 ID를 사용하여 사용자 풀을 선택합니다.
-
왼쪽 탐색 창에서 앱 통합 > 앱 클라이언트를 선택합니다.
-
이름이
m2m(machine-to-machine)로 끝나는 앱 클라이언트를 찾아 선택합니다. -
앱 클라이언트 세부 정보 페이지에서 클라이언트 ID를 복사합니다. 클라이언트 보안 암호를 표시하려면 클라이언트 보안 암호 표시를 선택한 다음 값을 복사합니다.
-
사용자 풀로 돌아가서 도메인 탭에서 사용자 풀 도메인을 가져옵니다.
-
도메인
/oauth2/token끝에를 추가하여 토큰 엔드포인트 URL을 구성합니다.
구성 단계
-
Amazon Quick에서 새 에이전트를 생성하거나 기존 에이전트를 선택합니다.
-
DLT MCP 서버와 상호 작용하는 방법을 설명하는 에이전트 프롬프트를 추가합니다.
-
새 작업을 추가하고 MCP Server 작업을 선택합니다.
-
MCP 서버 세부 정보를 구성합니다.
-
MCP 서버 URL: DLT MCP 엔드포인트
-
인증 유형: 서비스 기반 인증
-
토큰 엔드포인트: Cognito 토큰 엔드포인트 URL
-
클라이언트 ID: m2m 앱 클라이언트의 클라이언트 ID
-
클라이언트 보안 암호: m2m 앱 클라이언트의 클라이언트 보안 암호
-
-
MCP Server 작업 구성을 저장합니다.
-
에이전트에 새 MCP Server 작업을 추가합니다.
에이전트 시작 및 테스트
-
Amazon Quick에서 에이전트를 시작합니다.
-
자연어 프롬프트를 사용하여 에이전트와 대화를 시작합니다.
-
에이전트는 MCP 도구를 사용하여 로드 테스트 데이터를 검색하고 분석합니다.
프롬프트 예제
다음 예제에서는 AI 어시스턴트와 상호 작용하여 MCP 인터페이스를 통해 로드 테스트 데이터를 분석하는 방법을 보여줍니다. 특정 테스트 요구 사항에 맞게 테스트 IDs, 날짜 범위 및 기준을 사용자 지정합니다.
사용 가능한 MCP 도구 및 해당 파라미터에 대한 자세한 내용은 개발자 안내서의 MCP 도구 사양을 참조하세요.
간단한 테스트 결과 쿼리
MCP 서버와의 자연어 상호 작용은 다음과 같이 간단Show me the load tests that have completed in the last 24 hours with their associated completion status하거나 더 설명적일 수 있습니다.
Use list_scenarios to find my load tests. Then use get_latest_test_run to show me the basic execution data and performance metrics for the most recent test. If the results look concerning, also get the detailed performance metrics using get_test_run.
점진적 공개를 통한 대화형 성능 분석
I need to analyze my load test performance, but I'm not sure which specific tests to focus on. Please help me by:

1. First, use list_scenarios to show me available test scenarios
2. Ask me which tests I want to analyze based on the list you show me
3. For my selected tests, use list_test_runs to get the test run history
4. Then use get_test_run with the test_run_id to get detailed response times, throughput, and error rates
5. If I want to compare tests, use get_baseline_test_run to compare against the baseline
6. If there are any issues, use get_test_run_artifacts to help me understand what went wrong

Please guide me through this step by step, asking for clarification whenever you need more specific information.
프로덕션 준비 확인
Help me validate if my API is ready for production deployment:

1. Use list_scenarios to find recent test scenarios
2. For the most recent test scenario, use get_latest_test_run to get basic execution data
3. Use get_test_run with that test_run_id to get detailed response times, error rates, and throughput
4. Use get_scenario_details with the test_id to show me what load patterns and endpoints were tested
5. If I have a baseline, use get_baseline_test_run to compare current results with the baseline
6. Provide a clear go/no-go recommendation based on the performance data
7. If there are any concerns, use get_test_run_artifacts to help identify potential issues

My SLA requirements are: response time under [X]ms, error rate under [Y]%.
성능 추세 분석
Analyze the performance trend for my load tests over the past [TIME_PERIOD]:

1. Use list_scenarios to get all test scenarios
2. For each scenario, use list_test_runs with start_date and end_date to get tests from that period
3. Use get_test_run for the key test runs to get detailed metrics
4. Use get_baseline_test_run to compare against the baseline
5. Identify any significant changes in response times, error rates, or throughput
6. If you detect performance degradation, use get_test_run_artifacts on the problematic tests to help identify causes
7. Present the trend analysis in a clear format showing whether performance is improving, stable, or degrading

Focus on completed tests and limit results to [N] tests if there are too many.
실패한 테스트 문제 해결
Help me troubleshoot my failed load tests:

1. Use list_scenarios to find test scenarios
2. For each scenario, use list_test_runs to find recent test runs
3. Use get_test_run with the test_run_id to get the basic execution data and failure information
4. Use get_test_run_artifacts to get detailed error messages and logs
5. Use get_scenario_details to understand what was being tested when it failed
6. If I have a similar test that passed, use get_baseline_test_run to identify differences
7. Summarize the causes of failure and suggest next steps for resolution

Show me the most recent [N] failed tests from the past [TIME_PERIOD].
