Die vorliegende Übersetzung wurde maschinell erstellt. Im Falle eines Konflikts oder eines Widerspruchs zwischen dieser übersetzten Fassung und der englischen Fassung (einschließlich infolge von Verzögerungen bei der Übersetzung) ist die englische Fassung maßgeblich.
Daten in Grafana visualisieren und teilen
Dieses Tutorial führt Sie durch die Konfiguration des AWS IoT SiteWise Datenquellen-Plugins mit Grafana, einer Datenvisualisierungsplattform. Mit Grafana können Sie Dashboards erstellen, die Ihre Industriedaten visualisieren und überwachen. In diesem Tutorial wird ein Beispieldatensatz aus einer Windpark-Demonstration verwendet, um wichtige Konzepte zu veranschaulichen. Nachdem Sie sich mit dem Prozess vertraut gemacht haben, können Sie das Tutorial mit Ihren eigenen Daten wiederholen.
Nachdem Sie dieses Tutorial abgeschlossen haben, können Sie Folgendes tun:
-
Sammeln, Abfragen und Analysieren von Daten aus Industrieanlagen
-
Erstellen Sie interaktive Grafana-Dashboards zur Visualisierung von Kennzahlen zur Anlagenleistung
-
Überwachen Sie Betriebsdaten über eine einheitliche Oberfläche
-
Teilen Sie mithilfe der Kollaborationsfunktionen von Grafana Erkenntnisse mit Ihrem Team
-
Kombinieren Sie AWS IoT SiteWise Daten mit anderen AWS Datenquellen wie Amazon CloudWatch oder Amazon
Timestream
Themen
Voraussetzungen
Zum Durcharbeiten dieses Tutorials ist Folgendes erforderlich:
-
Ein AWS-Konto. Falls Sie noch keines haben, beachten Sie die Informationen unter Richten Sie ein Konto ein AWS.
-
Ein AWS Identity and Access Management (IAM-) Benutzer mit Administratorrechten. Detaillierte Anweisungen finden Sie unter Wie AWS IoT SiteWise funktioniert mit IAM.
-
Eine laufende AWS IoT SiteWise Demo.
Anmerkung
Dieses Tutorial erfordert die Verwendung von Ressourcen, die in Use the AWS IoT SiteWise demo erstellt wurden. Sie müssen es abschließen, bevor Sie mit diesem Tutorial fortfahren können.
Die Erstellung der Demo dauert in der Regel etwa 3 Minuten. Wenn die Demo nicht erstellt werden kann, deutet dies möglicherweise auf unzureichende Berechtigungen in Ihrem AWS Konto hin. Wechseln Sie in diesem Fall zu einem Konto mit Administratorzugriff. Weitere Informationen zu erforderlichen Berechtigungen finden Sie unter Wie AWS IoT SiteWise funktioniert mit IAM.
Wichtig
Behalten Sie alle Demo-Ressourcen, bis Sie dieses Tutorial abgeschlossen haben. Das Löschen von Komponenten kann die Funktionalität der Demo beeinträchtigen und Ihre Fähigkeit beeinträchtigen, Daten in Grafana anzuzeigen.
Schritt 1: Konfigurieren Sie Ihren Amazon Managed Grafana-Arbeitsbereich
In diesem Verfahren erstellen und konfigurieren Sie einen Amazon Managed Grafana-Arbeitsbereich zur Visualisierung Ihrer Windparkdaten.
-
Melden Sie sich bei der Amazon Managed Grafana-Konsole
an. -
Wählen Sie Workspace erstellen.
-
Geben Sie unter Workspace-Details einen Namen für Ihren Workspace ein, z. B.
SiteWiseTutorialDemo -
Wählen Sie unter Grafana-Version die neueste Version aus. Wählen Sie diese Version für die meisten up-to-date Funktionen und Fähigkeiten. Weitere Informationen zu verschiedenen Versionssätzen finden Sie unter Unterschiede zwischen Grafana-Versionen im Amazon Managed Grafana-Benutzerhandbuch.
-
Wählen Sie Weiter aus.
-
Wählen Sie unter Authentifizierungszugriff die Option AWS IAM Identity Center aus.
-
Wenn AWS IAM Identity Center in Ihrem Konto nicht aktiviert ist, werden Sie aufgefordert, es zuerst einzurichten. Eine ausführliche Anleitung zur Einrichtung des Benutzerzugriffs finden Sie unter Beispiele für identitätsbasierte Richtlinien für Amazon Managed Grafana im Amazon Managed Grafana-Benutzerhandbuch.
-
-
Wählen Sie unter Berechtigungstyp die Option Service managed aus. Amazon Managed Grafana erstellt und konfiguriert automatisch die erforderlichen IAM-Rollen und -Berechtigungen für alle AWS Datenquellen, die Sie in diesem Workspace verwenden möchten. Für Mitgliedskonten von Organisationen ist die Option Service managed nur verfügbar, wenn das Konto als delegierter Administrator benannt ist. Informationen zur Einrichtung delegierter Administratorkonten finden Sie unter Registrieren eines delegierten Administrator-Mitgliedskontos im CloudFormation Benutzerhandbuch.
-
Führen Sie unter Workspace-Konfigurationsoptionen die folgenden Aktionen aus:
-
Wählen Sie Grafana-Warnung einschalten aus. Mit dieser Einstellung können Sie Benachrichtigungen über eine zentrale Oberfläche in Ihrem Workspace erstellen und verwalten. Weitere Informationen finden Sie unter Arbeiten mit Grafana-Benachrichtigungen im Amazon Managed Grafana-Benutzerhandbuch.
-
Wählen Sie Plugin-Verwaltung einschalten aus. Auf diese Weise können Sie Plugins in Ihrem Workspace installieren, aktualisieren und deinstallieren. Weitere Informationen finden Sie unter Erweitern Sie Ihren Workspace mit Plugins im Amazon Managed Grafana-Benutzerhandbuch.
Wichtig
Achten Sie darauf, die Plugin-Verwaltung zu aktivieren. Wenn Sie diese Option nicht auswählen, können Sie im folgenden Schritt keine Datenquelle hinzufügen AWS IoT SiteWise .
-
-
Wählen Sie unter Netzwerkzugriffskontrolle die Option Offener Zugriff aus. In diesem Tutorial verwenden Sie Demo-Daten, damit Sie den Workspace öffentlich zugänglich machen können.
-
Offener Zugang — Ermöglicht den öffentlichen Zugriff auf deinen Workspace.
-
Eingeschränkter Zugriff — Beschränkt den Zugriff auf bestimmte IP-Bereiche oder VPC-Endpunkte. Weitere Informationen finden Sie unter So funktioniert VPC-Konnektivität im Amazon Managed Grafana-Benutzerhandbuch.
-
-
Wählen Sie Weiter aus.
-
Wählen Sie auf der Seite Einstellungen für verwaltete Serviceberechtigungen die Option Girokonto aus, damit Amazon Managed Grafana automatisch Richtlinien und Berechtigungen für den Zugriff auf AWS Daten in Ihrem Konto erstellt.
-
Wählen Sie unter Datenquellen die Option aus AWS IoT SiteWise. Weitere Informationen finden Sie unter Connect zu einer AWS IoT SiteWise Datenquelle herstellen im Amazon Managed Grafana-Benutzerhandbuch.
-
(Optional) Wählen Sie unter Benachrichtigungskanäle Amazon SNS aus, damit Grafana-Benachrichtigungen über Amazon SNS gesendet werden können. Dadurch wird eine IAM-Richtlinie erstellt, die das Veröffentlichen von Themen in Amazon SNS ermöglicht, deren Namen mit Grafana beginnen. Sie müssen die Einrichtung des Benachrichtigungskanals später in Ihrer Grafana-Konsole im Workspace abschließen.
-
Bestätigen Sie die Workspace-Details und wählen Sie Workspace erstellen. Dieser Vorgang dauert ein paar Minuten.
-
Weisen Sie auf der Registerkarte Authentifizierung unter AWS IAM Identity Center Ihrem Workspace Benutzer oder Gruppen zu, indem Sie wie folgt vorgehen:
-
Um dem Benutzer zuzuweisen, der die AWS IoT SiteWise Daten verwalten soll, wählen Sie Neuen Benutzer oder neue Gruppe zuweisen. Wählen Sie dann in der Dropdownliste Aktionen die Option Zum Administrator ernennen aus, um dem Benutzer Administratorrechte zu gewähren.
Wichtig
Um den Grafana-Workspace zu verwalten, müssen Sie die
AdminRolle mindestens einem Benutzer zuweisen. Dieser Benutzer hat vollen Zugriff auf die Grafana-Workspace-Konsole.
-
Sie haben jetzt Ihren Grafana-Workspace eingerichtet und konfiguriert. Im nächsten Schritt können Sie eine Datenquelle hinzufügen AWS IoT SiteWise und mit der Erstellung von Visualisierungen für Ihre Windparkdaten beginnen. Von Ihrem Workspace aus können Sie Ihre Industriedaten in Echtzeit abfragen, visualisieren und analysieren. Weitere Informationen zu Amazon Managed Grafana-Workspaces finden Sie unter Verwenden Sie Ihren Grafana-Workspace im Amazon Managed Grafana-Benutzerhandbuch.
Schritt 2: Als Datenquelle hinzufügen AWS IoT SiteWise
Um Ihnen bei der Visualisierung Ihrer Daten zu helfen, enthält Amazon Managed Grafana das AWS Data Sources-Plugin, das den Verbindungsprozess vereinfacht. AWS-Services Dieses Plugin ist in Ihrem Workspace vorinstalliert und bietet eine einheitliche Oberfläche für die Erkennung und Konfiguration von AWS Ressourcen als Datenquellen. Für die Visualisierung Ihres Windparks verwenden Sie dieses Plugin, um AWS IoT SiteWise eine Verbindung herzustellen. Weitere Informationen finden Sie unter Connect zu einer AWS IoT SiteWise Datenquelle herstellen im Amazon Managed Grafana-Benutzerhandbuch.
Bevor Sie mit der Abfrage Ihrer Windparkdaten beginnen können, benötigt das AWS Data Sources-Plugin die entsprechenden Berechtigungen für den Zugriff auf Ihre AWS IoT SiteWise Ressourcen. Diese Berechtigungen wurden automatisch konfiguriert, AWS IoT SiteWise als Sie im vorherigen Schritt eine Datenquelle ausgewählt haben. Weitere Informationen zu Plugin-Berechtigungen finden Sie unter Erforderliche Berechtigungen im Amazon Managed Grafana-Benutzerhandbuch.
Um eine Verbindung AWS IoT SiteWise zu Ihrem Grafana-Workspace herzustellen
-
Öffnen Sie die Amazon Managed Grafana-Konsole
. Wählen Sie auf Ihrer Workspace-Detailseite die URL aus, die unter Grafana-Workspace-URL angezeigt wird. Die Workspace-URL öffnet die Anmeldeseite der Grafana Workspace Console. -
Wählen Sie Mit AWS IAM Identity Center anmelden und geben Sie Ihre Anmeldeinformationen ein. Diese Anmeldeinformationen funktionieren nur, wenn Sie auf die E-Mail von Amazon Managed Grafana geantwortet haben, in der Sie aufgefordert wurden, ein Passwort für IAM Identity Center zu erstellen.
-
Wählen Sie im linken Navigationsbereich Apps, dann AWS Datenquellen und dann die AWS-ServicesRegisterkarte aus.
-
Wählen Sie unter Jetzt installieren aus AWS IoT SiteWise, um die neueste Version des AWS IoT SiteWise Plug-ins zu installieren.
-
Navigieren Sie zur Registerkarte Datenquellen und wählen Sie IoT SiteWise als Dienst aus.
-
Wählen Sie unter Standardregion die Region aus, aus der Sie Daten abrufen möchten, z. B. USA Ost (Nord-Virginia).
-
Nachdem Sie die Parameter für das Plugin angegeben haben, wählen Sie Datenquelle hinzufügen aus.
-
Wählen Sie Gehe zu Einstellungen.
-
Wählen Sie unter Verbindungsdetails die Option Speichern und testen aus, um sicherzustellen, dass der Dienst funktioniert.
Schritt 3: Erstellen Sie ein Dashboard, um Ihre Daten zu untersuchen und zu visualisieren
Erstellen Sie in diesem Schritt ein Grafana-Dashboard, um die zuvor erstellten Demo-Windparkdaten zu visualisieren. Dashboards helfen Ihnen bei der Überwachung Ihrer Daten, indem sie mehrere Visualisierungen in einer einzigen Ansicht anzeigen. Mithilfe von Dashboards können Sie Kennzahlen verfolgen, Muster analysieren und Erkenntnisse aus Ihren Industriedaten gewinnen. Weitere Informationen finden Sie unter Erstellen Sie Ihr erstes Dashboard im Amazon Managed Grafana-Benutzerhandbuch.
Um dein erstes Dashboard in Grafana zu erstellen
-
Wählen Sie im linken Navigationsbereich Dashboards und dann Dashboard erstellen aus, um mit der Erstellung Ihres ersten Dashboards zu beginnen.
-
Wählen Sie Visualisierung hinzufügen aus. Dadurch wird der Panel-Editor geöffnet, in dem Sie Datenquellen, Abfragen und Visualisierungseinstellungen konfigurieren können.
-
Wählen Sie auf der Registerkarte Abfrage die AWS IoT SiteWise Datenquelle aus dem Dropdownmenü aus.
-
Wählen Sie unter Abfragetyp im Dropdownmenü die Option Eigenschaftswertaggregate abrufen aus, um aggregierte Werte für Asset-Eigenschaften im Zeitverlauf abzurufen.
-
Wählen Sie Erkunden aus, um die verfügbaren Vermögenswerte in Ihrer Hierarchie anzuzeigen. Wählen Sie auf der Registerkarte Hierarchie die Option Demo Wind Farm Asset und dann Demo Turbine Asset 1 aus.
-
Wählen Sie unter Eigenschaft aus den verfügbaren Eigenschaften die Option Durchschnittliche Leistung aus. Wählen Sie Abfragen ausführen aus, um die Abfrage auszuführen, sodass Sie eine Vorschau der Ausgabe anzeigen können. Die Visualisierung wird aktualisiert und zeigt nun die durchschnittlichen Leistungsdaten für
Demo Turbine Asset 1. -
Geben Sie dem neuen Bereich im rechten Navigationsbereich einen Titel, z.
Turbine Demo 1 (Average Power)B. Wählen Sie Apply (Übernehmen), um die Änderungen zu speichern.Warnung
Wenn Sie Änderungen am Dashboard vornehmen, speichern Sie das Dashboard, bevor Sie die Seite aktualisieren oder die Seite verlassen. Andernfalls verlieren Sie Ihren Fortschritt.
-
Wählen Sie in der oberen rechten Ecke Dashboard speichern aus. Sie werden aufgefordert, einen Namen für Ihr Dashboard einzugeben, zum Beispiel.
SiteWise Wind Farm Demo Dashboard -
Wählen Sie Speichern.
Informationen zum Teilen von Dashboards finden Sie unter Teilen von Dashboards und Panels im Amazon Managed Grafana-Benutzerhandbuch.
Um ein weiteres Fenster zur Visualisierung der Windgeschwindigkeit hinzuzufügen
-
Wählen Sie Visualisierung hinzufügen aus, um ein leeres Fenster zu öffnen.
-
Wählen Sie auf der Registerkarte Abfrage die AWS IoT SiteWise Datenquelle aus dem Dropdownmenü aus.
-
Wählen Sie unter Abfragetyp im Dropdownmenü die Option Eigenschaftswert abrufen aus und wählen Sie
Demo Wind Farm Assetdann unter Asset die Option aus.Demo Turbine Asset 1 -
Wählen Sie unter Eigenschaft aus den verfügbaren Eigenschaften die Option Windgeschwindigkeit aus. Wählen Sie Abfragen ausführen aus, um die Änderungen zu aktualisieren.
-
Wählen Sie unter Visualisierung die Option Messgerät aus. Messgeräte eignen sich am besten zur Anzeige einzelner Echtzeitmetriken wie der Windgeschwindigkeit.
-
Geben Sie dem neuen Bereich im rechten Navigationsbereich einen Titel, z. B.
Turbine Demo 1 (Wind Speed) -
Wählen Sie in den Bedienfeldoptionen unter Standardoptionen die Option Einheit aus. Wählen Sie „Geschwindigkeit“ und anschließend „meters/second (m/s)“.
-
Wählen Sie Apply (Übernehmen), um die Änderungen zu speichern.
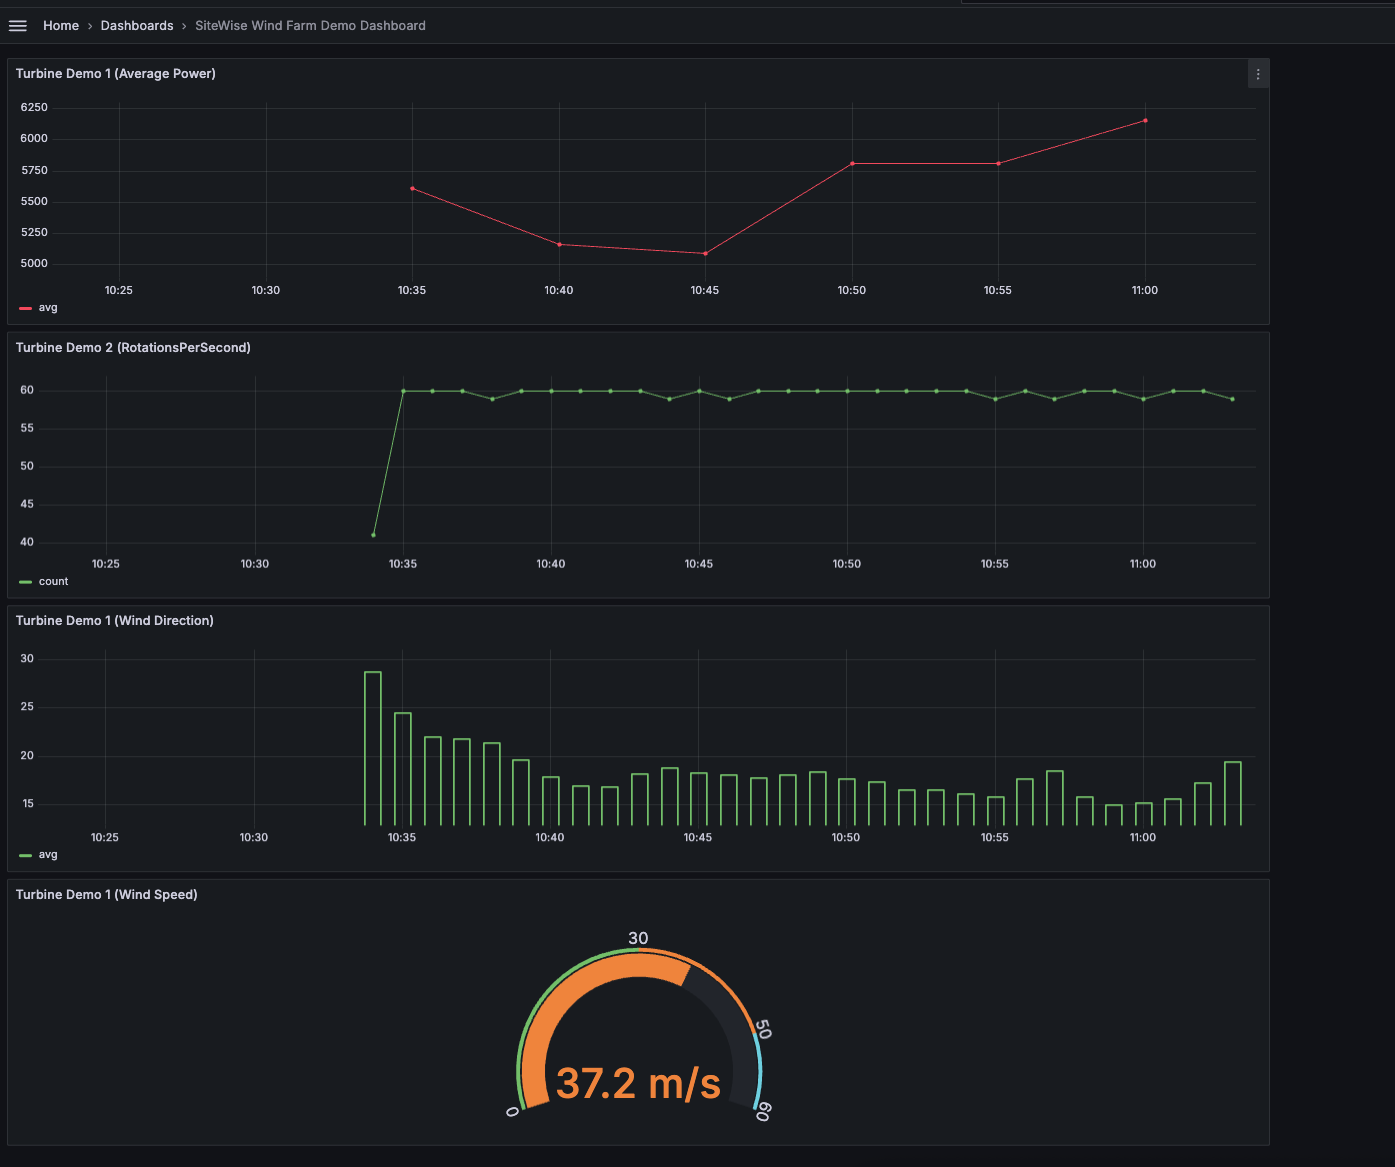
Die folgende Abbildung zeigt, wie Ihre Grafana-Dashboards aussehen könnten, wenn Sie diesen Schritt abschließen.
(optional) Schritt 4: Richten Sie Warnmeldungen ein, um die Leistung zu überwachen
Warnmeldungen weisen auf Statusänderungen hin, nachdem sie aufgetreten sind, um Leistungsprobleme mit Ihren Industrieanlagen zu identifizieren. Weitere Informationen finden Sie unter Amazon Managed Grafana-Warnmeldungen im Amazon Managed Grafana-Benutzerhandbuch.
Um Benachrichtigungen in Grafana einzurichten
-
Wählen Sie auf der Registerkarte Regel die
Turbine Demo 1 (Average Power)Optionen Alle bis auswerten5mund Für bis15maus. Diese Konfiguration bewertet den durchschnittlichen Stromverbrauch alle 5 Minuten und löst eine Warnung aus, wenn der Zustand länger als 15 Minuten andauert. -
Wählen Sie unter Bedingungen die Option LIEGT UNTER UND geben Sie Watt ein
7,020. Mit dieser Einstellung werden Sie benachrichtigt, wenn die durchschnittlichen Turbinenbedingungen länger als 5 Minuten unter 7.020 Watt fallen. Weitere Informationen zum Erstellen von Benachrichtigungen finden Sie unter Felder für Warnmeldungsregeln im Amazon Managed Grafana-Benutzerhandbuch.
Sie haben das Tutorial abgeschlossen. In diesem Verfahren haben Sie einen Grafana-Workspace erstellt und ihn für die Visualisierung von AWS IoT SiteWise Windparkdaten konfiguriert. Sie haben ein interaktives Dashboard mit mehreren Widget-Typen erstellt, darunter ein Zeitreihendiagramm für die durchschnittliche Leistung und ein Messgerät für die Windgeschwindigkeit. Außerdem richten Sie Warnmeldungen ein, um die Turbinenleistung zu überwachen, sodass Sie potenzielle Probleme erkennen können, bevor sie die Produktion stören. Sie können Ihr Dashboard weiter verbessern, indem Sie weitere Visualisierungen hinzufügen, zusätzliche Warnmeldungen erstellen oder andere AWS Datenquellen verbinden, um tiefere Einblicke in Ihre industriellen Abläufe zu erhalten.
Schritt 5: Ressourcen nach dem Tutorial bereinigen
Nachdem Sie dieses Tutorial zur Datenvisualisierung mit Grafana abgeschlossen haben, sollten Sie Ihre Ressourcen bereinigen, um zusätzliche Kosten zu vermeiden.
Um die Demo zu löschen AWS IoT SiteWise
Navigieren Sie zur AWS IoT SiteWise -Konsole
. Wählen Sie in der oberen rechten Ecke der Seite die Option Demo löschen aus.
Geben Sie in das Bestätigungsfeld
DELETEein, und wählen Sie dann Delete (Löschen).
Weitere Informationen finden Sie unter Löschen Sie die AWS IoT SiteWise Demo.
Wenn Sie ein Amazon Managed Grafana löschen, werden auch alle Konfigurationsdaten für diesen Workspace gelöscht. Dazu gehören Dashboards, Datenquellenkonfiguration, Benachrichtigungen und Snapshots.
Um einen Amazon Managed Grafana-Workspace zu löschen
Öffnen Sie die Amazon Managed Grafana-Konsole
. Wählen Sie im linken Navigationsbereich das Menüsymbol.
Wählen Sie Alle Workspaces.
Wählen Sie den Namen des Workspace, den Sie löschen möchten.
Wählen Sie Löschen aus.
Um den Löschvorgang zu bestätigen, gib den Namen des Workspace ein und wähle Löschen.
Anmerkung
Mit diesem Verfahren wird ein Workspace gelöscht. Andere Ressourcen dürfen nicht gelöscht werden. Beispielsweise werden IAM-Rollen, die vom Workspace verwendet wurden, nicht gelöscht (sie können jedoch entsperrt werden, wenn sie nicht mehr verwendet werden).
Weitere Informationen finden Sie unter Löschen eines Amazon Managed Grafana-Workspace im Amazon Managed Grafana-Benutzerhandbuch.
Weitere Ressourcen
Weitere Informationen zur Visualisierung von Daten finden Sie in den folgenden Ressourcen:
-
Fehlerbehebung bei Amazon Managed Grafana-Identität und Zugriff im Amazon Managed Grafana-Benutzerhandbuch
-
Bewährte Sicherheitsmethoden im Amazon Managed Grafana-Benutzerhandbuch
-
Verarbeiten und visualisieren Sie Daten mit SiteWise Edge- und Open-Source-Tools
-
Benutzer, Teams und Berechtigungen im Amazon Managed Grafana-Benutzerhandbuch
-
Amazon Managed Grafana-Berechtigungen und Richtlinien für AWS Datenquellen im Amazon Managed Grafana-Benutzerhandbuch
