Monitor the solution
Logging and notifications
Instance Scheduler uses structured logging optimized for CloudWatch Logs Insights queries. This solution logs processing information for each tagged instance, the results of the period evaluation for the instance, the desired state of the instance during that period, the applied action, and debugging messages.
Logs are written to Amazon CloudWatch Logs in two log groups:
-
{stackName}-{namespace}-administrative-logs -
Logs for resource registration and deregistration, custom resource operations, CLI requests, and other administrative activities.
-
{stackName}-{namespace}-scheduling-logs -
Logs for scheduling operations including orchestration and request handler execution.
Warning and error logs are also forwarded to a solution-created Amazon SNS topic, which can be configured to send messages to a subscribed email address. You can find the name of the Amazon SNS topic in the Outputs tab of the solution stack.
Informational tags
When informational tagging is enabled (the default), Instance Scheduler writes tags directly to managed resources to provide at-a-glance visibility into the solution’s scheduling activity. These tags are applied using the AWS Resource Groups Tagging API and are updated each time the scheduler processes a resource.
You can enable or disable this feature using the Enable informational tagging parameter on the hub stack. For more information, refer to Update global configuration settings.
Informational tag keys
The following tags are written to managed resources:
| Tag key | Description |
|---|---|
|
|
The ARN of the Instance Scheduler hub stack managing this resource. Applied when a resource is first registered for scheduling and on each subsequent scheduling action. |
|
|
The last scheduling action taken on the resource, along with a UTC
timestamp. For example: |
|
|
If the scheduler encounters an error while processing a resource, this
tag contains the error code and a UTC timestamp. For example:
|
|
|
A human-readable description of the error. This tag is only present
when |
Error codes
The following error codes may appear in the IS-Error tag:
| Error code | Description |
|---|---|
|
|
The schedule name specified in the resource’s schedule tag does not match any schedule defined in the configuration table. |
|
|
The resource type is not supported for scheduling (for example, a read replica of another RDS instance). |
|
|
The schedule assigned to the resource is not compatible with the resource type (for example, an ASG schedule that uses unsupported cron expressions). |
|
|
The scheduler attempted to start the resource but the operation failed. |
|
|
The scheduler attempted to stop the resource but the operation failed. |
|
|
The scheduler attempted to configure scheduled scaling rules on an Auto Scaling group but the operation failed. |
|
|
An unexpected error occurred while processing the resource. |
Tag behavior
-
When a resource is first registered for scheduling, the
IS-ManagedBytag is applied immediately. -
When a resource is deregistered (the schedule tag is removed), all informational tags (
IS-ManagedBy,IS-LastAction,IS-Error,IS-ErrorMessage) are removed from the resource. -
Error tags are not re-written on each scheduling interval if the same error persists and the existing tag is still present on the resource. They are only updated when the error code changes.
-
All tag values are truncated to 256 characters to comply with AWS tagging limits.
Tag governance considerations
Important
Instance Scheduler creates and updates the tags listed above on managed resources as part of normal operation. If your organization enforces tag governance through AWS Config rules, tag policies, service control policies, or automated remediation, ensure that your change management controls are configured to allow the following tag keys:
-
IS-ManagedBy -
IS-LastAction -
IS-Error -
IS-ErrorMessage -
IS-PreferredInstanceTypes(if using alternate instance types) -
IS-MinDesiredMax(if scheduling Auto Scaling groups)
If you cannot accommodate these tags in your governance policies,
disable informational tagging by setting the Enable informational
tagging parameter to No on the hub stack. Note that this will also
disable the IS-ManagedBy tag that is used to confirm resource
registration.
Control tags
In addition to informational tags, Instance Scheduler uses the following control tags for specific features:
| Tag key | Description |
|---|---|
|
|
A comma-separated list of alternate EC2 instance types to try when starting an instance fails due to insufficient capacity. For more information, refer to Handling EC2 Insufficient Capacity Errors. |
|
|
The minimum, desired, and maximum capacity values for an Auto Scaling
group in the format |
Tag capacity
Important
AWS resources typically have a limit of 50 tags per resource. Instance Scheduler may use up to 6 tags on a resource (4 informational tags plus up to 2 control tags). Ensure your resources have sufficient tag capacity to accommodate Instance Scheduler tags alongside your existing tagging strategy.
If a resource is at or near the 50-tag limit, informational tag writes may fail. The scheduler logs these failures but continues scheduling operations. Check CloudWatch Logs if you suspect tagging issues.
CloudWatch Logs Insights queries
Instance Scheduler’s structured logging format enables efficient querying using CloudWatch Logs Insights. You can use Logs Insights to search, analyze, and visualize log data to troubleshoot operational issues and monitor scheduling activity.
Instance Scheduler provides pre-formatted log queries that you can access from the Saved Queries section in the CloudWatch Logs console:
-
SchedulingHistory -
Query scheduling actions performed on resources, including start and stop operations.
-
RegistrationEvents -
Query resource registration and deregistration events.
-
Errors -
Query error logs to troubleshoot issues with the solution.
For more information about CloudWatch Logs Insights, refer to Analyzing log data with CloudWatch Logs Insights in the Amazon CloudWatch Logs User Guide.
Operational insights dashboard
The Operational Insights dashboard provides visibility into solution performance and cost savings from scheduled instance management.
To access the dashboard, ensure Operational Monitoring is set to "enabled" in the hub stack parameters. Navigate to CloudWatch and select "Dashboards" from the navigation menu. The dashboard name is *{stack-name}-Operational-Insights-Dashboard*.
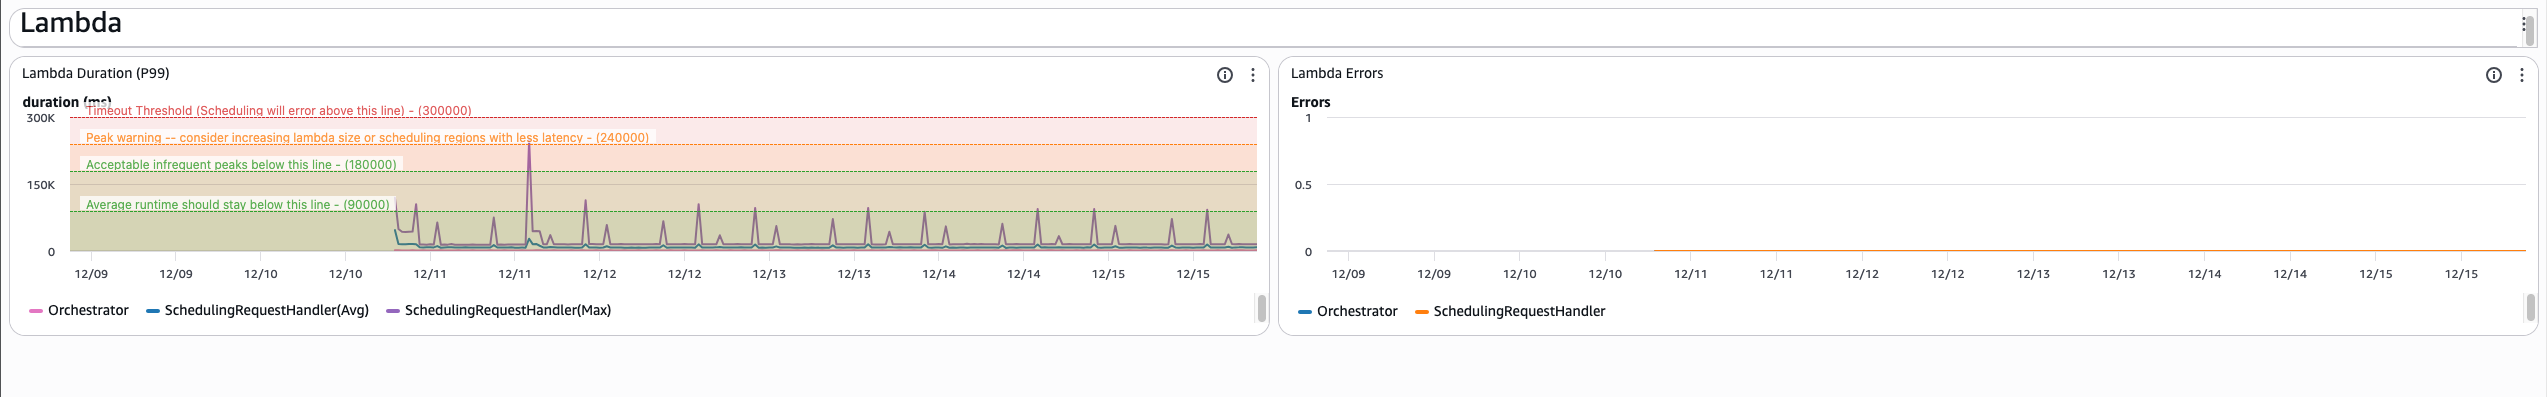
The dashboard displays managed instance counts, running hours saved, and Lambda function performance metrics.
Operational insights dashboard overview

Note
The information in these graphs is dependent upon the scheduling interval configured on the solution hub stack. When updating the solution’s scheduling interval, the dashboard will only display scheduling metrics from after the most recent update to the scheduling interval.
Monitor Lambda execution times to ensure optimal performance (see Quotas). If execution times consistently approach the timeout threshold, consider increasing the Lambda size property or deploying Instance Scheduler to a region with lower latency to your managed regions.
Lambda metrics showing duration and error counts
Additional costs associated with this feature
This operational dashboard is powered by custom CloudWatch metrics collected by the solution that will incur additional cost. This feature can be turned off by disabling "Operational Monitoring" on the solution hub stack. This feature costs an additional $3.00/month plus additional scaling costs based on the size of your deployment. The costs are as follows:
| Custom CloudWatch Dashboard | $3 |
|---|---|
|
Per-instance-type metrics |
$0.90 per instance type* |
|
API usage |
~$0.10 per active target** |
*These costs are tracked per service category (EC2/RDS) and only for instance types actually used for scheduling.
*
Monitoring EventBridge Events
Instance Scheduler publishes scheduling and registration events to EventBridge event buses to provide visibility into solution operations and enable integration with other AWS services.
Event types
The solution publishes two main categories of events:
Scheduling events: Published when Instance Scheduler takes action to start, stop, or configure managed resources. These events include details about the instance, schedule, and action taken. start, stop, or configure managed resources. These events include details about the instance, schedule, and action taken.
Registration events: Published when resources are registered or unregistered for scheduling based on tagging operations.
Event destinations
IS-LocalEvents event buses: An IS-LocalEvents event bus is deployed
in each managed region of each member account (including the hub account).
Each bus receives events for scheduling actions and resource registrations
within that region.
IS-GlobalEvents event bus: The IS-GlobalEvents event bus in the hub
account receives a copy of each event sent to any IS-LocalEvents event
bus, providing centralized monitoring across all accounts and regions.
Using EventBridge events
You can create EventBridge rules to:
-
Monitor scheduling operations across your infrastructure
-
Trigger notifications when instances are started or stopped
-
Integrate with other AWS services for automated workflows
-
Implement compliance monitoring and alerting
Event structure
All events use the standard EventBridge format. The following examples show the structure for each event type:
Scheduling event:
{
  "Source": "instance-scheduler",
  "DetailType": "Scheduling Action",
  "Resources": ["arn:aws:ec2:us-east-1:123456789012:instance/i-1234567890abcdef0"],
  "Detail": {
    "account": "123456789012",
    "region": "us-east-1",
    "service": "ec2",
    "resource_id": "i-1234567890abcdef0",
    "requested_action": "Start",
    "action_taken": "Started",
    "schedule": "office-hours"
  }
}
Registration event:
{
  "Source": "instance-scheduler",
  "DetailType": "Resource Registered",
  "Resources": ["arn:aws:ec2:us-east-1:123456789012:instance/i-1234567890abcdef0"],
  "Detail": {
    "account": "123456789012",
    "region": "us-east-1",
    "service": "ec2",
    "resource_id": "i-1234567890abcdef0",
    "schedule": "office-hours"
  }
}
Each event contains these key fields:
-
Source- Identifies the event source as "instance-scheduler" -
DetailType- Specifies the event category: "Scheduling Action" for instance operations or "Resource Registered" for tagging events -
Resources- Array containing the ARNs of affected AWS resources -
Detail- Contains the event payload with account ID, region, service type (ec2/rds), resource ID, schedule name, and for scheduling events, both the requested action and actual result
Possible requested_action values for scheduling events:
-
Start: Scheduler intended to start the instance -
Stop: Scheduler intended to stop the instance -
Configure: Scheduler intended to configure the instance
Possible action_taken values for scheduling events:
-
Started: Instance was started -
Stopped: Instance was stopped -
Hibernated: Instance was hibernated -
Configured: Instance configuration was modified -
Error: An error occurred during the scheduling operation
Creating EventBridge rules
To monitor Instance Scheduler events:
-
Navigate to the EventBridge console in your AWS account
-
Create a new rule targeting either the
IS-GlobalEventsevent bus (for centralized monitoring) orIS-LocalEventsevent bus (for local monitoring) -
Define event patterns to match Instance Scheduler events
-
Configure targets such as SNS topics, Lambda functions, or CloudWatch Logs
For more information about EventBridge, refer to What is Amazon EventBridge? in the Amazon EventBridge User Guide.
