Using layer maps
Use layer maps to visualize data with custom geographic boundaries, such as congressional districts, sales territories, or user-defined regions. With layer maps, Quick authors upload GeoJSON files to Amazon Quick that shape layers over a base map and join with Quick data to visualize associated metrics and dimensions. Shape layers can be styled by color, border, and opacity. Quick authors can also add interactivity to layer maps through tooltips and custom actions.
Note
Amazon Quick layer map visuals only support polygon shapes. Line and point geometries are not supported.
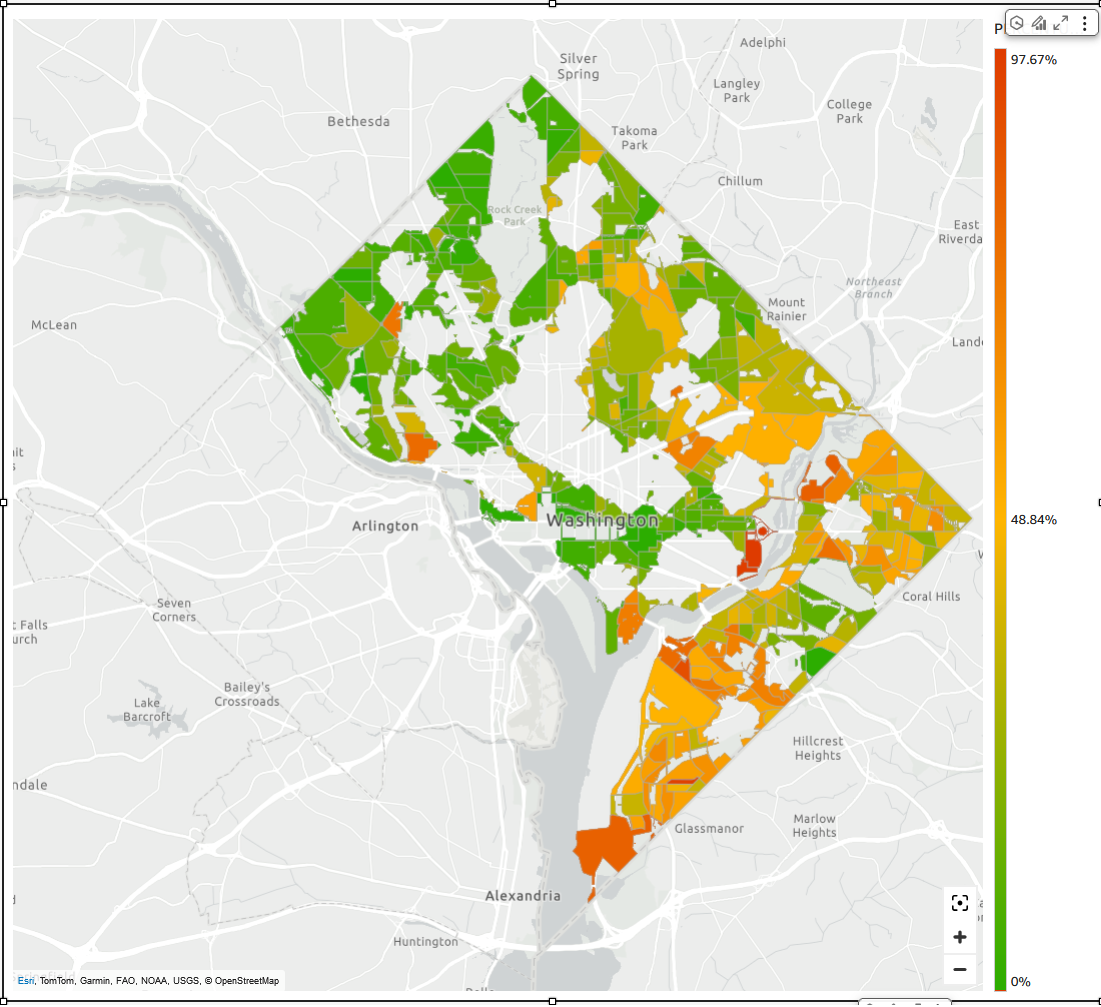
The following image shows a layer map visual in Amazon Quick.
Creating a shape layer with layered maps
Use the procedure below to create a shape layer with layer map visuals in Amazon Quick.
-
Open the Quick console
. -
Open the Quick analysis that you want to add a layer map to.
-
Choose Add on the application bar, and then choose Add visual.
-
On the Visual types pane, choose one of the layer map icon.
-
An empty map visual appears in the analysis and prompts you to continue configuring the layer. Choose CONFIGURE LAYER to continue configuring the layer map.
-
The Layer properties pane opens to the right. Navigate to the Shape file section, and then choose UPLOAD SHAPE FILE.
-
Choose the GeoJSON file that you want to visualize. The file must be in
.geojsonformat and must not exceed 100 MB. -
Navigate to the Data section.
-
For Shape file key field, choose the field that you want the shape to visualize.
-
(Optional) For Dataset key field, choose the dataset field that you want the shape to visualize. To assign color to the shapes, add a color field. If the color field is a measure, the shape uses gradient coloring. If the color field is a dimension, the shape uses categorical coloring. If a color field is not assigned to the shape, use the fill color option in the Styling section of the Layer properties pane to set a common color for all shapes.
-
(Optional) To change the layer name, navigate to the Layer options section and enter a name in the Layer name input.
-
(Optional) To change the fill or border colors, navigate to the Styling section and choose the color switch next to the object that you want to change. To adjust the opacity of the color, enter a percentage amount in the input located next to the eye icon. If you do not assign a color field to the Dataset key field, the fill color can be used to set a common color for all shapes.
