Unified operational monitoring with Cluster Insights
Amazon OpenSearch Service now includes Cluster Insights, a monitoring solution that provides comprehensive operational visibility of your clusters through a single dashboard. This eliminates the complexity of having to analyze and correlate various logs and metrics to identify potential risks to cluster availability or performance. The solution automates the consolidation of critical operational data across nodes, indices, and shards, transforming complex troubleshooting into a streamlined process. You can detect issues like large shards and low disk watermarks, view detailed metrics at the node, index, and shard levels, and access security and resiliency best practices.
Note
Cluster Insights is available at no additional cost with the following version support:
-
Amazon OpenSearch Service console (Cluster Health tab): Available for Elasticsearch 6.8 and later, and all OpenSearch versions (1.0+).
-
OpenSearch Dashboards UI (via OpenSearch UI application): Requires OpenSearch 2.17 or later. Domains running earlier versions can be associated as data sources but will not appear in the Cluster Insights Overview in the UI. Domains with OpenSearch versions 2.17 and 2.19 also need to be on the latest service software version update.
-
Query View tab (in OpenSearch Dashboards UI): Requires OpenSearch 2.19 or later.
Note: Domains running OpenSearch versions earlier than 2.17 can be associated as data sources in the OpenSearch UI application, but will not appear in the Cluster Insights Overview. Only domains running OpenSearch 2.17 or later are fully supported for Cluster Insights in the Dashboards UI.
Benefits
Proactive monitoring - Monitor cluster health proactively with detailed performance metrics across all components - from individual nodes and indices to shards and search queries.
Unified visibility - Consolidate monitoring data into a single dashboard
Actionable recommendations - Get step-by-step guidance for issue resolution
Comprehensive coverage - Monitor security, stability, and resiliency across your OpenSearch clusters
Query optimization - Identify resource-intensive queries and optimize performance
With Cluster Insights, you can maintain optimal cluster performance, reduce operational overhead, and ensure consistent best practices across your OpenSearch clusters
Access Cluster Insights through Console
Review performance and resilience recommendations and make necessary configuration changes, all within the same Console. In the Console, under the Cluster health tab, you can access Cluster Insights that lists all the active Insights. Click on any Insight to view the recommendations.
Screen-1: Cluster Insights under the Cluster Health tab

Access Cluster Insights and detailed metrics through OpenSearch UI
You can view insights for a specific OpenSearch Service cluster through the OpenSearch UI (Dashboards). In OpenSearch UI, an application is simply an organizational construct like a folder. Each application can connect to and display insights for multiple OpenSearch Service clusters. Accessing Cluster Insights requires an administrative role in the OpenSearch UI application.
Note
Accessing Cluster Insights requires an administrative role in the OpenSearch UI application.
Create and configure an application to view Cluster Insights
-
Open the OpenSearch Service console at https://console.aws.amazon.com/aos/home
-
Choose OpenSearch UI (Dashboards) from the left navigation
-
Complete the following steps to create and configure an application:
-
After you complete these two steps, you can view Cluster Insights in OpenSearch UI dashboard. Choose the Settings icon, then choose Data administrator > Cluster Insights.
Screen-2: Access Data Administrator from OpenSearch UI

Screen-3: Cluster Insights under the Manage data section

Understanding Cluster Insights
This section describes the various insights available in Cluster Insights.
Overview Dashboard
The Cluster Insights Overview page, as shown in the following screenshot, provides a high-level view of your cluster health at the application level and comprises the following sections:
Screen-4: Cluster Insights landing page in OpenSearch UI application.

Current cluster status
A donut chart displays your cluster health status:
Green - All primary shards and replicas are allocated to nodes
Yellow - All primary shards are allocated, but some replicas aren't
Red - At least one primary shard is not allocated to any node
Insights trend
The trend graph tracks issue patterns over the past 30 days, helping you identify emerging problems and monitor resolution progress.
Current open insights
A count organized by severity of open insights for the last 30 days.
OpenSearch Service Clusters
This section lists all your OpenSearch clusters with key statistics including node count, shard count, and active queries.
Top insights by severity
You can review insights across all domains in your application. This section prioritizes issues that need immediate attention (Critical, and High Severity). Each insight includes a description and specific recommendations, which can help you focus on critical issues first.
Insight details
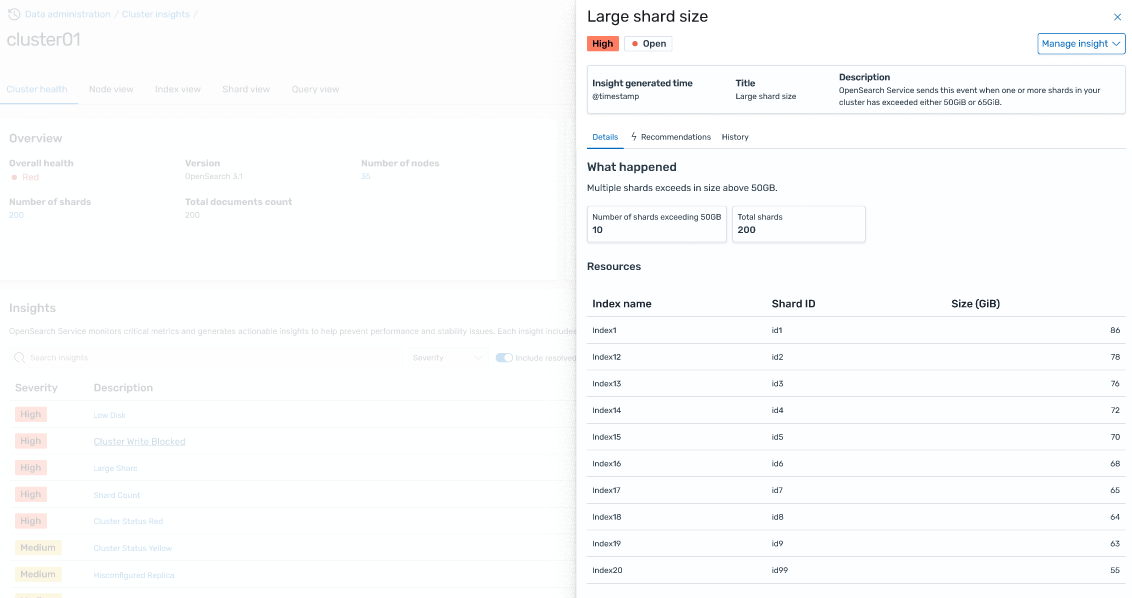
Each insight in the Top insights by severity section is interactive and provides detailed analysis. For example, when you choose the Large Shard Size insight:
You see how many shards exceed the threshold and which indices are affected.
A resource map identifies each oversized shard with its index, ID, and current size.
The recommendations tab provides step-by-step remediation guidance.
The History tab displays a timeline of resource remediation actions.
Cluster Details
When you select a specific cluster in the OpenSearch Service Clusters section, OpenSearch displays insights for that cluster across the following tabs: Cluster health, Nodes view, Index view, Shard view, and Query view. The Cluster health tab displays the following information:
Overview
Key information includes cluster health, shard count, node count, index count, and document statistics.
Configuration best practices
Donut charts show compliance with recommended settings for resilience, and security.
Insights
A table lists recent insights generated for the cluster, with the same detailed breakdown and remediation guidance available from the overview page.
Screen-5: Cluster Health overview provides key metrics, best practices, and Insights

When you click on any insights, you can see details and impacted resources, recommendations. In addition, you can also see history of fixed resources.
Screen-6: Insight details. Provides you details, recommendations, and historical timeline.
Metrics Section
Interactive charts in this section display the following cluster metrics:
Overall cluster health metrics such as Cluster Status, Write status, and searchable documents
KPIs (Key Performance Indicators) like Indexing and Search rates and latencies
Resource Utilization metrics like JVM and CPU utilization
Node, Index, and Shard views
The Node, Index, and Shard views use OpenSearch stats to provide detailed visibility into cluster operations. You can view:
Real-time metrics such as CPU utilization and JVM memory pressure
Search and indexing performance data
Resource hotspots across cluster components
Granular node-level diagnostics
Top shard heap allocated
Screen-7: Node, Index, and Shard level metrics

Query View
Note
Query View feature is supported for OpenSearch versions 2.19 or later.
The Query View page helps you monitor resource-intensive queries with:
Access Setup
Viewing Top N queries requires fine-grained access control permissions. Ensure the following:
Fine-grained access control is enabled on your domain.
Your IAM role (or internal user) is mapped to an OpenSearch role with the required cluster permissions for query insights.
For full admin access, map your IAM role ARN as a backend role to both the all_access and security_manager roles. You can do this in OpenSearch Dashboards under Security > Roles > select the role > Mapped users > Manage mapping, or by using the Security API
(PUT _plugins/_security/api/rolesmapping/all_access).
Without proper role mappings, users may receive 403 Forbidden errors when attempting to access query insights data. For details, see Fine-grained access control.
Live dashboards
View execution stats, CPU and memory usage, and completion progress for every query.
Top N queries
A ranked table shows the most significant queries with details including:
Query count
Latency, CPU, and memory usage
Search type and coordinator node
Target indices and shard count
Query details
Double-click any query to see:
Exact query payload and execution steps
Latency breakdown for each phase (expand, query, fetch)
Optimization recommendations
Screen-8: In-flight live view. You can also view Top-N queries

Access Insights through Amazon EventBridge events
You can monitor insights through Amazon EventBridge events. For additional details check notifications.
