Example: Draw clustered points
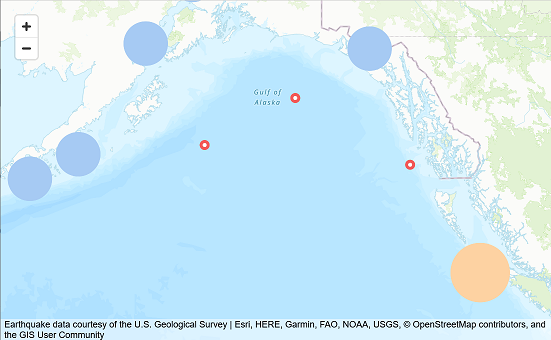
Using USGS earthquake data, this code example shows how to draw points that cluster together when they are close together on the map. Uses MapLibre, Node.js, React, Amplify, and JavaScript.
Samples GitHub link: Interactive map with clusters of points
