SCAD Containers Cost Allocation Dashboard
Introduction
The SCAD Containers Cost Allocation Dashboard provides insights into EKS and ECS in-cluster cost based on data from CUR’s Split Cost Allocation Data (SCAD) feature. DevOps teams, FinOps team or any relevant stakeholder can gain insights into cost of Kubernetes workloads inside their EKS and ECS clusters, down to the EKS pod/ECS task level, and aggregated based on different Kubernetes constructs (pod, namespace, controller, and more) or ECS and Batch dimensions. You can use it to implement showback and chargeback methodologies for multi-tenant EKS and ECS clusters. The dashboard’s visualizations include high-level KPI visuals to understand general spend, and interactive visuals that allow easy-to-use experience to drill down into EKS and ECS in-cluster cost.
The dashboard has three tabs:
-
Executive Summary:
-
KPI visuals per cost metric (CPU cost, GPU cost, RAM cost, shared cost, total cost)
-
Total Cost by Account ID
-
Top Spending Clusters
-
-
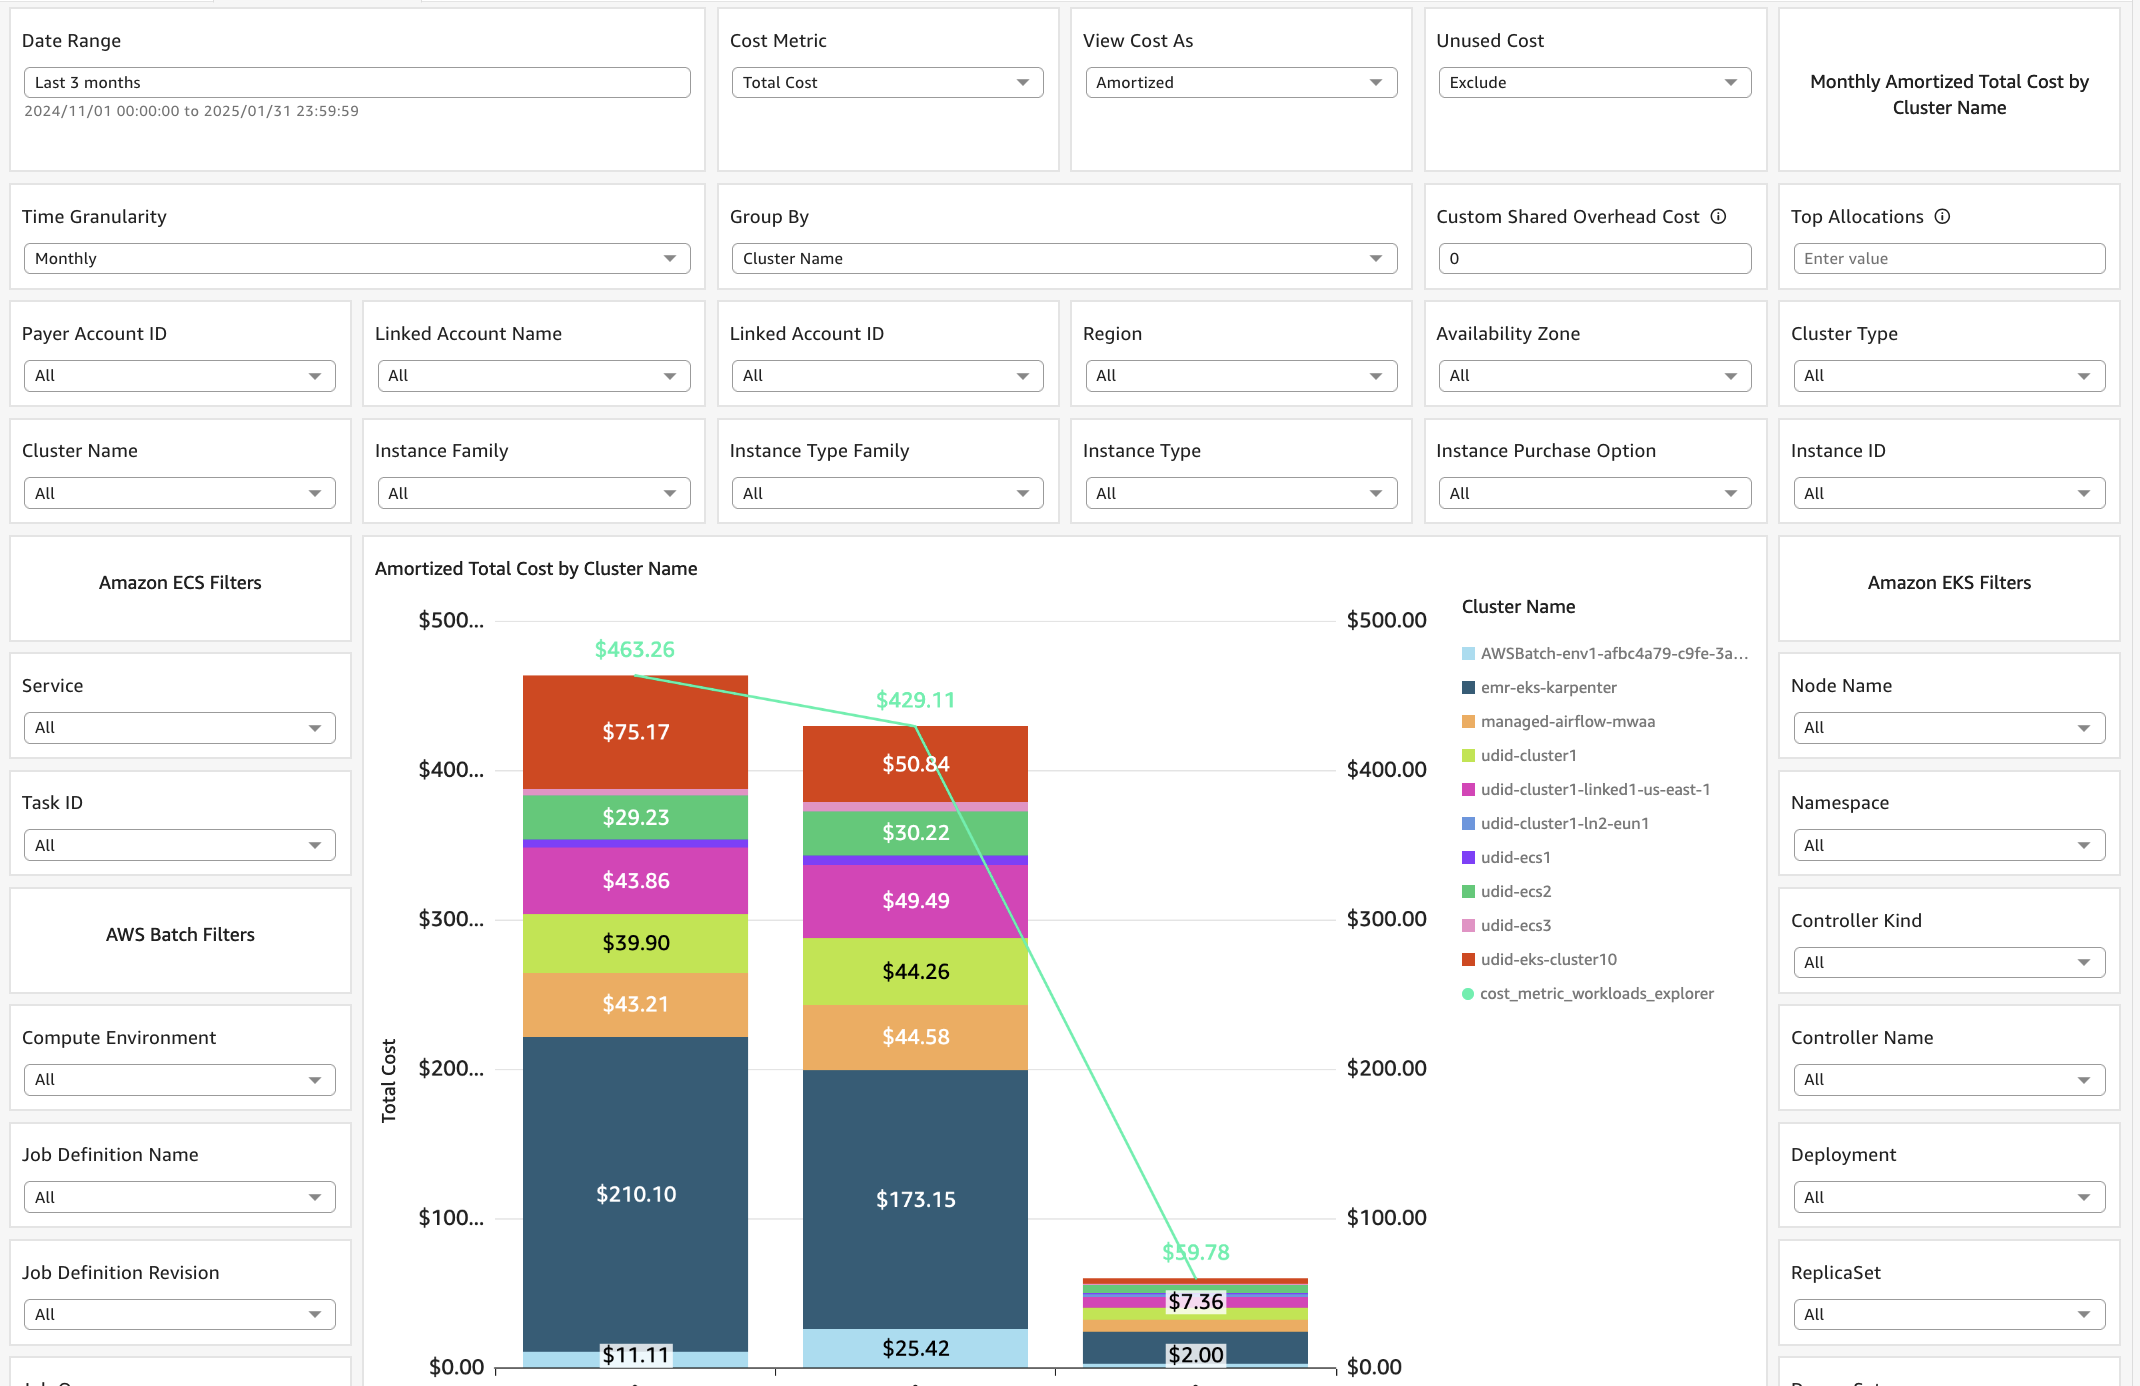
Workloads Explorer:
-
Interactive stacked-bar chart and pivot table visuals that show cost by different dimensions based on in-dashboard aggregations and filters
-
-
Cluster Breakdown:
-
Coverage and drill-down visuals
-
-
Labels/Tags Explorer:
-
Drill down into your pods/tasks split cost by dimensions that are customized using K8s pod labels/AWS ECS tasks tags, and combine them with tagged AWS resources costs to implement Total Cost of Ownership (TCO)
-
-
Data on EKS:
-
Allocate costs to Spark and Flink applications running on EKS (directly or using EMR on EKS), with ability to combine EMR on EKS service cost and split cost
-
Demo Dashboard
Get more familiar with the Dashboard using the live, interactive demo
dashboard following this link
SCAD - Containers Cost Allocation Dashboard
CID’s Containers Cost Allocation Dashboards Comparison
The CID framework has two Containers Cost Allocation dashboards:
-
This one, which is based on CUR’s Split Cost Allocation Data (SCAD)
-
The Kubecost Containers Cost Allocation Dashboard, which is based on data collection from Kubecost
Please review the Containers Cost Allocation dashboards comparison in the FAQs for more information.
Learn more
-
Split Cost Allocation Data for EKS documentation:
Authors
-
Udi Dahan, Senior Technical Account Manager
Feedback & Support
Follow Feedback & Support guide
Have a success story to share with the Team, suggest an improvement or report an error?
-
Please email: containers-cost-allocation-dashboard@amazon.com
Note
These dashboards and their content: (a) are for informational purposes only, (b) represent current AWS product offerings and practices, which are subject to change without notice, and (c) does not create any commitments or assurances from AWS and its affiliates, suppliers or licensors. AWS content, products or services are provided "as is" without warranties, representations, or conditions of any kind, whether express or implied. The responsibilities and liabilities of AWS to its customers are controlled by AWS agreements, and this document is not part of, nor does it modify, any agreement between AWS and its customers.
