翻訳は機械翻訳により提供されています。提供された翻訳内容と英語版の間で齟齬、不一致または矛盾がある場合、英語版が優先します。
OpenTelemetry Ruby への移行
Ruby アプリケーションを X-Ray SDK 計装から OpenTelemetry 計装に移行するには、次のコード例と手動計装のガイダンスを使用します。
セクション
SDK を使用してソリューションを手動で計装する
- Tracing setup with X-Ray SDK
-
X-Ray SDK for Ruby では、サービスプラグインを使用してコードを設定する必要がありました。
require 'aws-xray-sdk' XRay.recorder.configure(plugins: [:ec2, :elastic_beanstalk]) - Tracing setup with OpenTelemetry SDK
-
注記
X-Ray リモートサンプリングは現在、OpenTelemetry Ruby 用に設定することはできません。
Ruby on Rails アプリケーションの場合は、設定コードを Rails イニシャライザに配置します。詳細については、「 の使用開始
」を参照してください。手動で計装されたすべての Ruby プログラムでは、 OpenTelemetry::SDK.configureメソッドを使用して OpenTelemetry Ruby SDK を設定する必要があります。まず、以下のパッケージをインストールします。
bundle add opentelemetry-sdk opentelemetry-exporter-otlp opentelemetry-propagator-xray次に、プログラムが初期化されたときに実行される設定コードを使用して OpenTelemetry SDK を設定します。以下のコンポーネントを設定することをお勧めします。
-
OTLP Exporter– CloudWatch エージェントと OpenTelemetry コレクターへのトレースのエクスポートに必要です。 -
An AWS X-Ray Propagator– X-Ray と統合された AWS サービスにトレースコンテキストを伝達するために必要です
require 'opentelemetry-sdk'
require 'opentelemetry-exporter-otlp'

# Import the gem containing the AWS X-Ray for OTel Ruby ID Generator and propagator
require 'opentelemetry-propagator-xray'

OpenTelemetry::SDK.configure do |c|
  c.service_name = 'my-service-name'

  c.add_span_processor(
    # Use the BatchSpanProcessor to send traces in groups instead of one at a time
    OpenTelemetry::SDK::Trace::Export::BatchSpanProcessor.new(
      # Use the default OLTP Exporter to send traces to the ADOT Collector
      OpenTelemetry::Exporter::OTLP::Exporter.new(
        # The OpenTelemetry Collector is running as a sidecar and listening on port 4318
        endpoint:"http://127.0.0.1:4318/v1/traces"
      )
    )
  )

  # The X-Ray Propagator injects the X-Ray Tracing Header into downstream calls
  c.propagators = [OpenTelemetry::Propagator::XRay::TextMapPropagator.new]
end
OpenTelemetry SDK には、ライブラリ計装の概念もあります。これらを有効にすると、 AWS SDK などのライブラリのスパンが自動的に作成されます。OpenTelemetry には、すべてのライブラリ計装を有効にするか、どのライブラリ計装を有効にするかを指定するオプションがあります。
すべての計装を有効にするには、まず
opentelemetry-instrumentation-allパッケージをインストールします。bundle add opentelemetry-instrumentation-all次に、設定を以下のように更新して、すべてのライブラリ計装を有効にします。
require 'opentelemetry/instrumentation/all'
...

OpenTelemetry::SDK.configure do |c|
   ...

  c.use_all() # Enable all instrumentations
end
OpenTelemetry SDK には、ライブラリ計装の概念もあります。これらを有効にすると、 AWS SDK などのライブラリのスパンが自動的に作成されます。OpenTelemetry には、すべてのライブラリ計装を有効にするか、どのライブラリ計装を有効にするかを指定するオプションがあります。
すべての計装を有効にするには、まず
opentelemetry-instrumentation-allパッケージをインストールします。bundle add opentelemetry-instrumentation-all次に、設定を以下のように更新して、すべてのライブラリ計装を有効にします。
require 'opentelemetry/instrumentation/all' ... OpenTelemetry::SDK.configure do |c| ... c.use_all() # Enable all instrumentations end -
受信リクエストのトレース (Rails の計装)
- With X-Ray SDK
-
X-Ray SDK では、X-Ray トレースは初期化時に Rails フレームワーク用に設定されます。
例 – config/initializers/aws_xray.rb
Rails.application.config.xray = { name: 'my app', patch: %I[net_http aws_sdk], active_record: true } - With OpenTelemetry SDK
まず、以下のパッケージをインストールします。
bundle add opentelemetry-instrumentation-rack opentelemetry-instrumentation-rails opentelemetry-instrumentation-action_pack opentelemetry-instrumentation-active_record opentelemetry-instrumentation-action_view次に、以下に示すように、Rails アプリケーションの計装を有効にするように設定を更新します。
# During SDK configuration
OpenTelemetry::SDK.configure do |c|

  ...

  c.use 'OpenTelemetry::Instrumentation::Rails'
  c.use 'OpenTelemetry::Instrumentation::Rack'
  c.use 'OpenTelemetry::Instrumentation::ActionPack'
  c.use 'OpenTelemetry::Instrumentation::ActiveSupport'
  c.use 'OpenTelemetry::Instrumentation::ActionView'

  ...

end
AWS SDK 計測
- With X-Ray SDK
-
AWS SDK からの送信 AWS リクエストを計測するために、 AWS SDK クライアントには次の例のように X-Ray のパッチが適用されます。
require 'aws-xray-sdk' require 'aws-sdk-s3' # Patch AWS SDK clients XRay.recorder.configure(plugins: [:aws_sdk]) # Use the instrumented client s3 = Aws::S3::Client.new s3.list_buckets - With OpenTelemetry SDK
AWS SDK for Ruby V3 は、OpenTelemetry トレースの記録と出力をサポートします。サービスクライアントの OpenTelemetry を設定する方法については、 AWS SDK for Ruby の「オブザーバビリティ機能の設定」を参照してください。
送信 HTTP 呼び出しの計測
外部サービスに対して HTTP 呼び出しを行う場合、自動計装が利用できない場合や、十分な詳細が得られない場合は、呼び出しの手動計装が必要になる場合があります。
- With X-Ray SDK
-
ダウンストリームコールを計装する際、X-Ray SDK for Ruby は、アプリケーションで使用する
net/httpライブラリにパッチを適用するために使用されました。require 'aws-xray-sdk' config = { name: 'my app', patch: %I[net_http] } XRay.recorder.configure(config) - With OpenTelemetry SDK
OpenTelemetry を使用して
net/http計装を有効にするには、まずopentelemetry-instrumentation-net_httpパッケージをインストールします。bundle add opentelemetry-instrumentation-net_http次に、以下のように設定を更新して
net/http計装を有効にします。OpenTelemetry::SDK.configure do |c| ... c.use 'OpenTelemetry::Instrumentation::Net::HTTP' ... end
他のライブラリの計装サポート
OpenTelemetry Ruby でサポートされているライブラリ計装の全リストは、「opentelemetry-ruby-contrib
または、OpenTelemetry レジストリを検索して、OpenTelemetry が計装をサポートしているかどうかを調べることもできます。詳細については、「Registry
トレースデータを手動で作成する
- With X-Ray SDK
-
X-Ray を使用して、アプリケーションを追跡するセグメントとその子サブセグメントを手動で作成するには、
aws-xray-sdkパッケージが必要でした。セグメントまたはサブセグメントに X-Ray 注釈とメタデータを追加する場合もありました。require 'aws-xray-sdk' ... # Start a segment segment = XRay.recorder.begin_segment('my-service') # Add annotations (indexed key-value pairs) segment.annotations[:user_id] = 'user-123' segment.annotations[:payment_status] = 'completed' # Add metadata (non-indexed data) segment.metadata[:order] = { id: 'order-456', items: [ { product_id: 'prod-1', quantity: 2 }, { product_id: 'prod-2', quantity: 1 } ], total: 67.99 } # Add metadata to a specific namespace segment.metadata(namespace: 'payment') do |metadata| metadata[:transaction_id] = 'tx-789' metadata[:payment_method] = 'credit_card' end # Create a subsegment with annotations and metadata segment.subsegment('payment-processing') do |subsegment1| subsegment1.annotations[:payment_id] = 'pay-123' subsegment1.metadata[:details] = { amount: 67.99, currency: 'USD' } # Create a nested subsegment subsegment1.subsegment('operation-2') do |subsegment2| # Do more work... end end # Close the segment segment.close - With OpenTelemetry SDK
-
カスタムスパンを使用すると、計装ライブラリでキャプチャされない内部アクティビティのパフォーマンスをモニタリングできます。Server タイプのスパンのみが X-Ray セグメントに変換され、他のすべてのスパンは X-Ray サブセグメントに変換されることに注意してください。デフォルトでは、スパンは
INTERNALです。まず、
OpenTelemetry.tracer_provider.tracer('<YOUR_TRACER_NAME>')メソッドで取得できるスパンを生成するためにトレーサーを作成します。これにより、アプリケーションの OpenTelemetry 設定にグローバルに登録されているトレーサーインスタンスが提供されます。アプリケーション全体で 1 つのトレーサーを持つことが一般的です。OpenTelemetry トレーサーを作成し、それを使用してスパンを作成します。require 'opentelemetry-sdk' ... # Get a tracer tracer = OpenTelemetry.tracer_provider.tracer('my-application') # Create a server span (equivalent to X-Ray segment) tracer.in_span('my-application', kind: OpenTelemetry::Trace::SpanKind::SERVER) do |span| # Do work... # Create nested spans of default kind INTERNAL will become an X-Ray subsegment tracer.in_span('operation-1') do |child_span1| # Set attributes (equivalent to X-Ray annotations and metadata) child_span1.set_attribute('key', 'value') # Do more work... tracer.in_span('operation-2') do |child_span2| # Do more work... end end endOpenTelemetry SDK を使用してトレースに注釈とメタデータを追加する
set_attributeメソッドを使用して、各スパンに属性を追加します。デフォルトでは、これらのスパン属性はすべて X-Ray の未加工データのメタデータに変換されることに注意してください。属性がメタデータではなく注釈に変換されるようにするには、その属性のキーをaws.xray.annotations属性のリストに追加します。詳細については、「Enable The Customized X-Ray Annotations」を参照してください。 # SERVER span will become an X-Ray segment tracer.in_span('my-server-operation', kind: OpenTelemetry::Trace::SpanKind::SERVER) do |span| # Your server logic here span.set_attribute('attribute.key', 'attribute.value') span.set_attribute("metadataKey", "metadataValue") span.set_attribute("annotationKey1", "annotationValue") # Create X-Ray annotations span.set_attribute("aws.xray.annotations", ["annotationKey1"]) end
Lambda の手動計装
- With X-Ray SDK
-
Lambda でアクティブトレースを有効にした後、X-Ray SDK を使用するために必要な追加の設定はありません。Lambda は Lambda ハンドラー呼び出しを表すセグメントを作成し、追加の設定なしで X-Ray SDK を使用してサブセグメントまたは計装ライブラリを作成できます。
- With OpenTelemetry SDK
次のサンプル Lambda 関数コード (計装なし) を検討してください。
require 'json'
def lambda_handler(event:, context:)
    # TODO implement
    { statusCode: 200, body: JSON.generate('Hello from Lambda!') }
end
Lambda を手動で計装するには、以下を行う必要があります。
Lambda に次の gem を追加します。
gem 'opentelemetry-sdk'
gem 'opentelemetry-exporter-otlp'
gem 'opentelemetry-propagator-xray'
gem 'aws-distro-opentelemetry-exporter-xray-udp'
gem 'opentelemetry-instrumentation-aws_lambda'
gem 'opentelemetry-propagator-xray', '~> 0.24.0' # Requires version v0.24.0 or higher
Lambda ハンドラーの外部で OpenTelemetry SDK を初期化します。OpenTelemetry SDK は、以下を使用して設定することをお勧めします。
-
Lambda の UDP X-Ray エンドポイントにトレースを送信するための X-Ray UDP スパンエクスポーターを備えたシンプルなスパンプロセッサ
-
X-Ray Lambda プロパゲーター
-
Lambda 関数名に設定する
service_name設定
-
Lambda ハンドラークラスで、次の行を追加して Lambda ハンドラーを計装します。
  class Handler
        extend OpenTelemetry::Instrumentation::AwsLambda::Wrap
        ...

        instrument_handler :process
    end
次のコードは、必要な変更が行われた後の Lambda 関数を示しています。追加のカスタムスパンを作成すると、自動的に提供されるスパンを補完できます。
require 'json'
require 'opentelemetry-sdk'
require 'aws/distro/opentelemetry/exporter/xray/udp'
require 'opentelemetry/propagator/xray'
require 'opentelemetry/instrumentation/aws_lambda'

# Initialize OpenTelemetry SDK outside handler
OpenTelemetry::SDK.configure do |c|
  # Configure the AWS Distro for OpenTelemetry X-Ray Lambda exporter
  c.add_span_processor(
    OpenTelemetry::SDK::Trace::Export::SimpleSpanProcessor.new(
      AWS::Distro::OpenTelemetry::Exporter::XRay::UDP::AWSXRayUDPSpanExporter.new
    )
  )

  # Configure X-Ray Lambda propagator
  c.propagators = [OpenTelemetry::Propagator::XRay.lambda_text_map_propagator]

  # Set minimal resource information
  c.resource = OpenTelemetry::SDK::Resources::Resource.create({
    OpenTelemetry::SemanticConventions::Resource::SERVICE_NAME => ENV['AWS_LAMBDA_FUNCTION_NAME']
  })
  c.use 'OpenTelemetry::Instrumentation::AwsLambda'
end

module LambdaFunctions
  class Handler
    extend OpenTelemetry::Instrumentation::AwsLambda::Wrap
    def self.process(event:, context:)
      "Hello!"
    end
    instrument_handler :process
  end
end
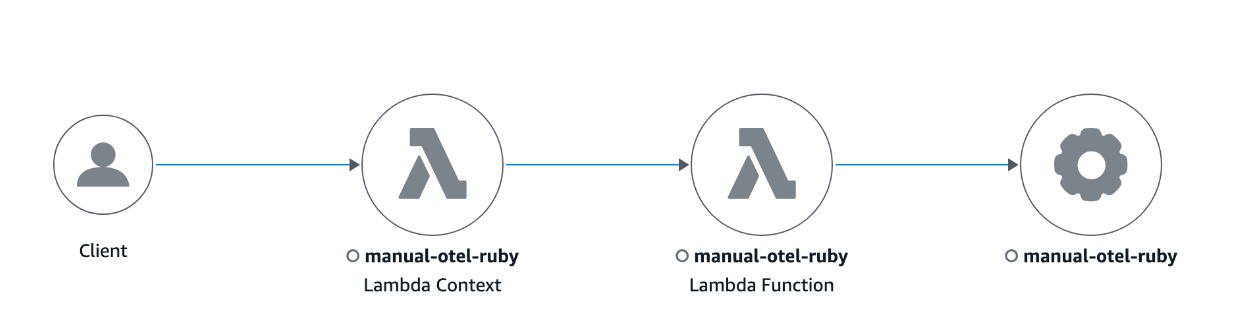
以下は、Ruby で記述された計装済みの Lambda 関数のトレースマップの例です。
Lambda レイヤーを使用して、Lambda の OpenTelemetry を設定することもできます。詳細については、「OpenTelemetry AWS-Lambda Instrumentation
