MCP サーバー統合
ソリューションのデプロイ中にオプションの MCP サーバーコンポーネントをデプロイした場合、分散負荷テストソリューションをモデルコンテキストプロトコルをサポートする AI 開発ツールと統合できます。MCP サーバーは、AI アシスタントを介して負荷テストを取得、管理、分析するためのプログラムによるアクセスを提供します。
お客様は、選択したクライアント (Amazon Q、Claude など) を使用して DLT MCP サーバーに接続できます。それぞれの設定手順は若干異なります。このセクションでは、MCP Inspector、Kiro CLI、Cline、Amazon Quick の設定手順について説明します。
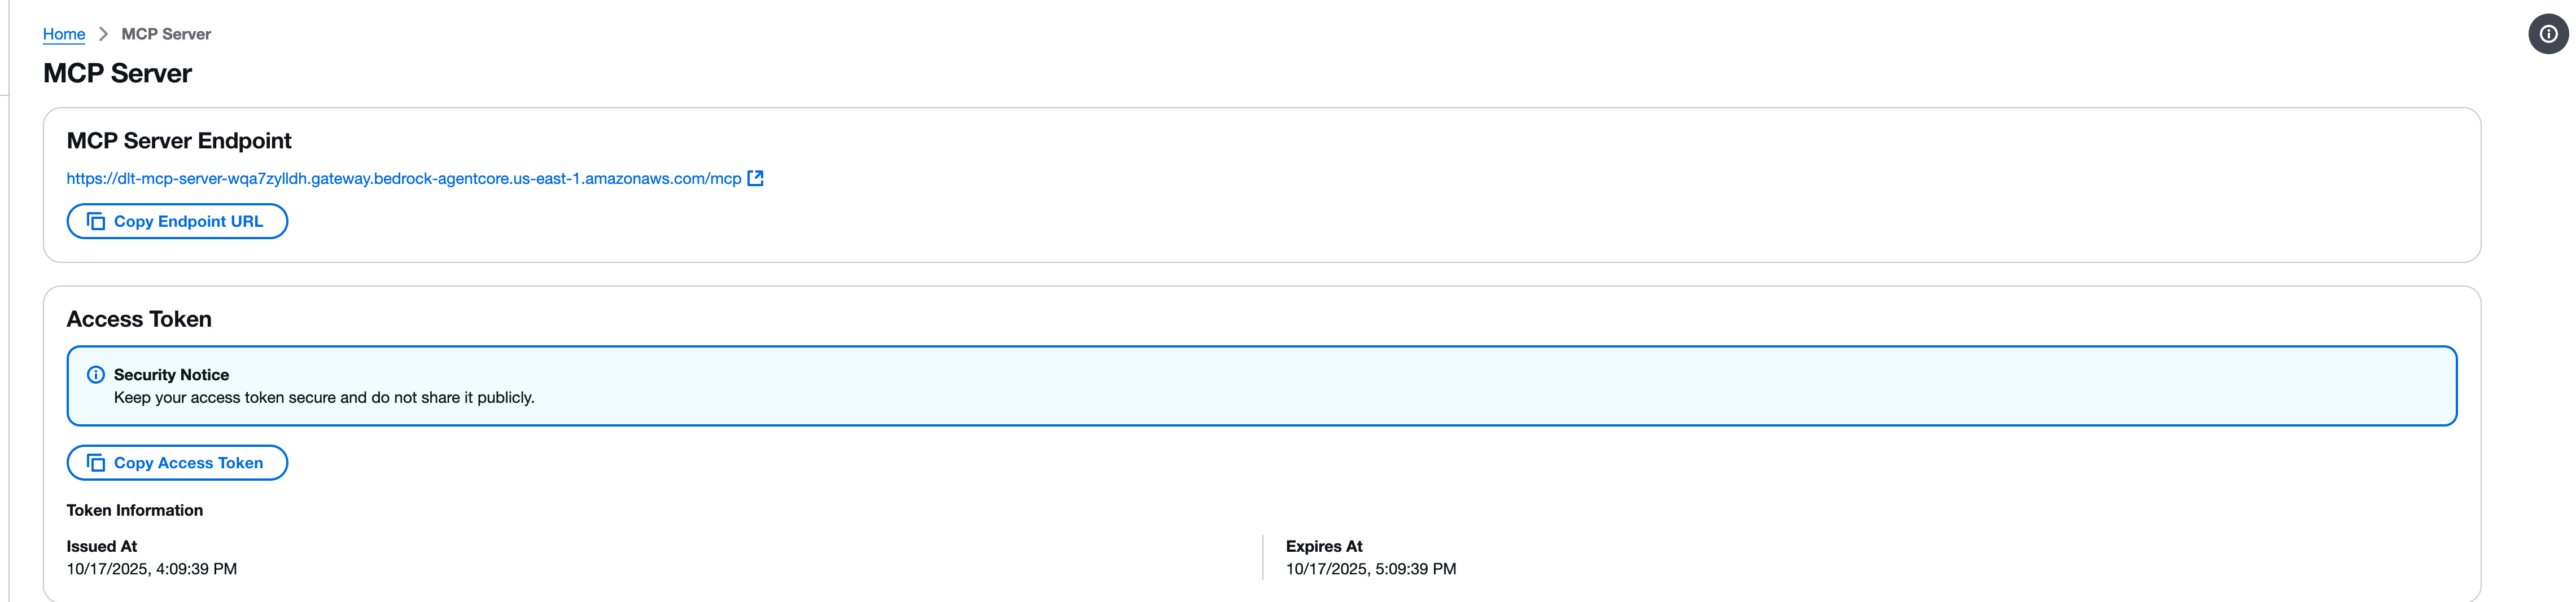
ステップ 1: MCP エンドポイントとアクセストークンを取得する
MCP クライアントを設定する前に、DLT ウェブコンソールから MCP サーバーエンドポイントとアクセストークンを取得する必要があります。
-
分散負荷テストウェブコンソールの [MCP サーバー] ページに移動します。
-
[MCP サーバーエンドポイント] セクションを見つけます。
-
[エンドポイント URL のコピー] ボタンを使用してエンドポイント URL をコピーします。エンドポイント URL の形式は、
https://{gateway-id}.gateway.bedrock-agentcore.{region}.amazonaws.com/mcpです。 -
[アクセストークン] セクションを見つけます。
-
[アクセストークンをコピー] ボタンを使用して、アクセストークンをコピーします。
重要
アクセストークンは安全に保管し、公開しないでください。トークンは、MCP インターフェイスを介して分散負荷テストソリューションへの読み取り専用アクセスを提供します。
ステップ 2: MCP Inspector を使用してテストする
モデルコンテキストプロトコルは、MCP サーバーに直接接続してツールを呼び出すためのツールである MCP Inspector
注記
MCP Inspector にはバージョン 0.17 以降が必要です。すべてのリクエストを JSON RPC で直接行うこともできますが、MCP Inspector はより使いやすいインターフェイスを提供します。
MCP Inspector をインストールして起動する
-
必要に応じて、npm をインストールします。
-
次のコマンドを実行して、MCP Inspector を起動します。
npx @modelcontextprotocol/inspector
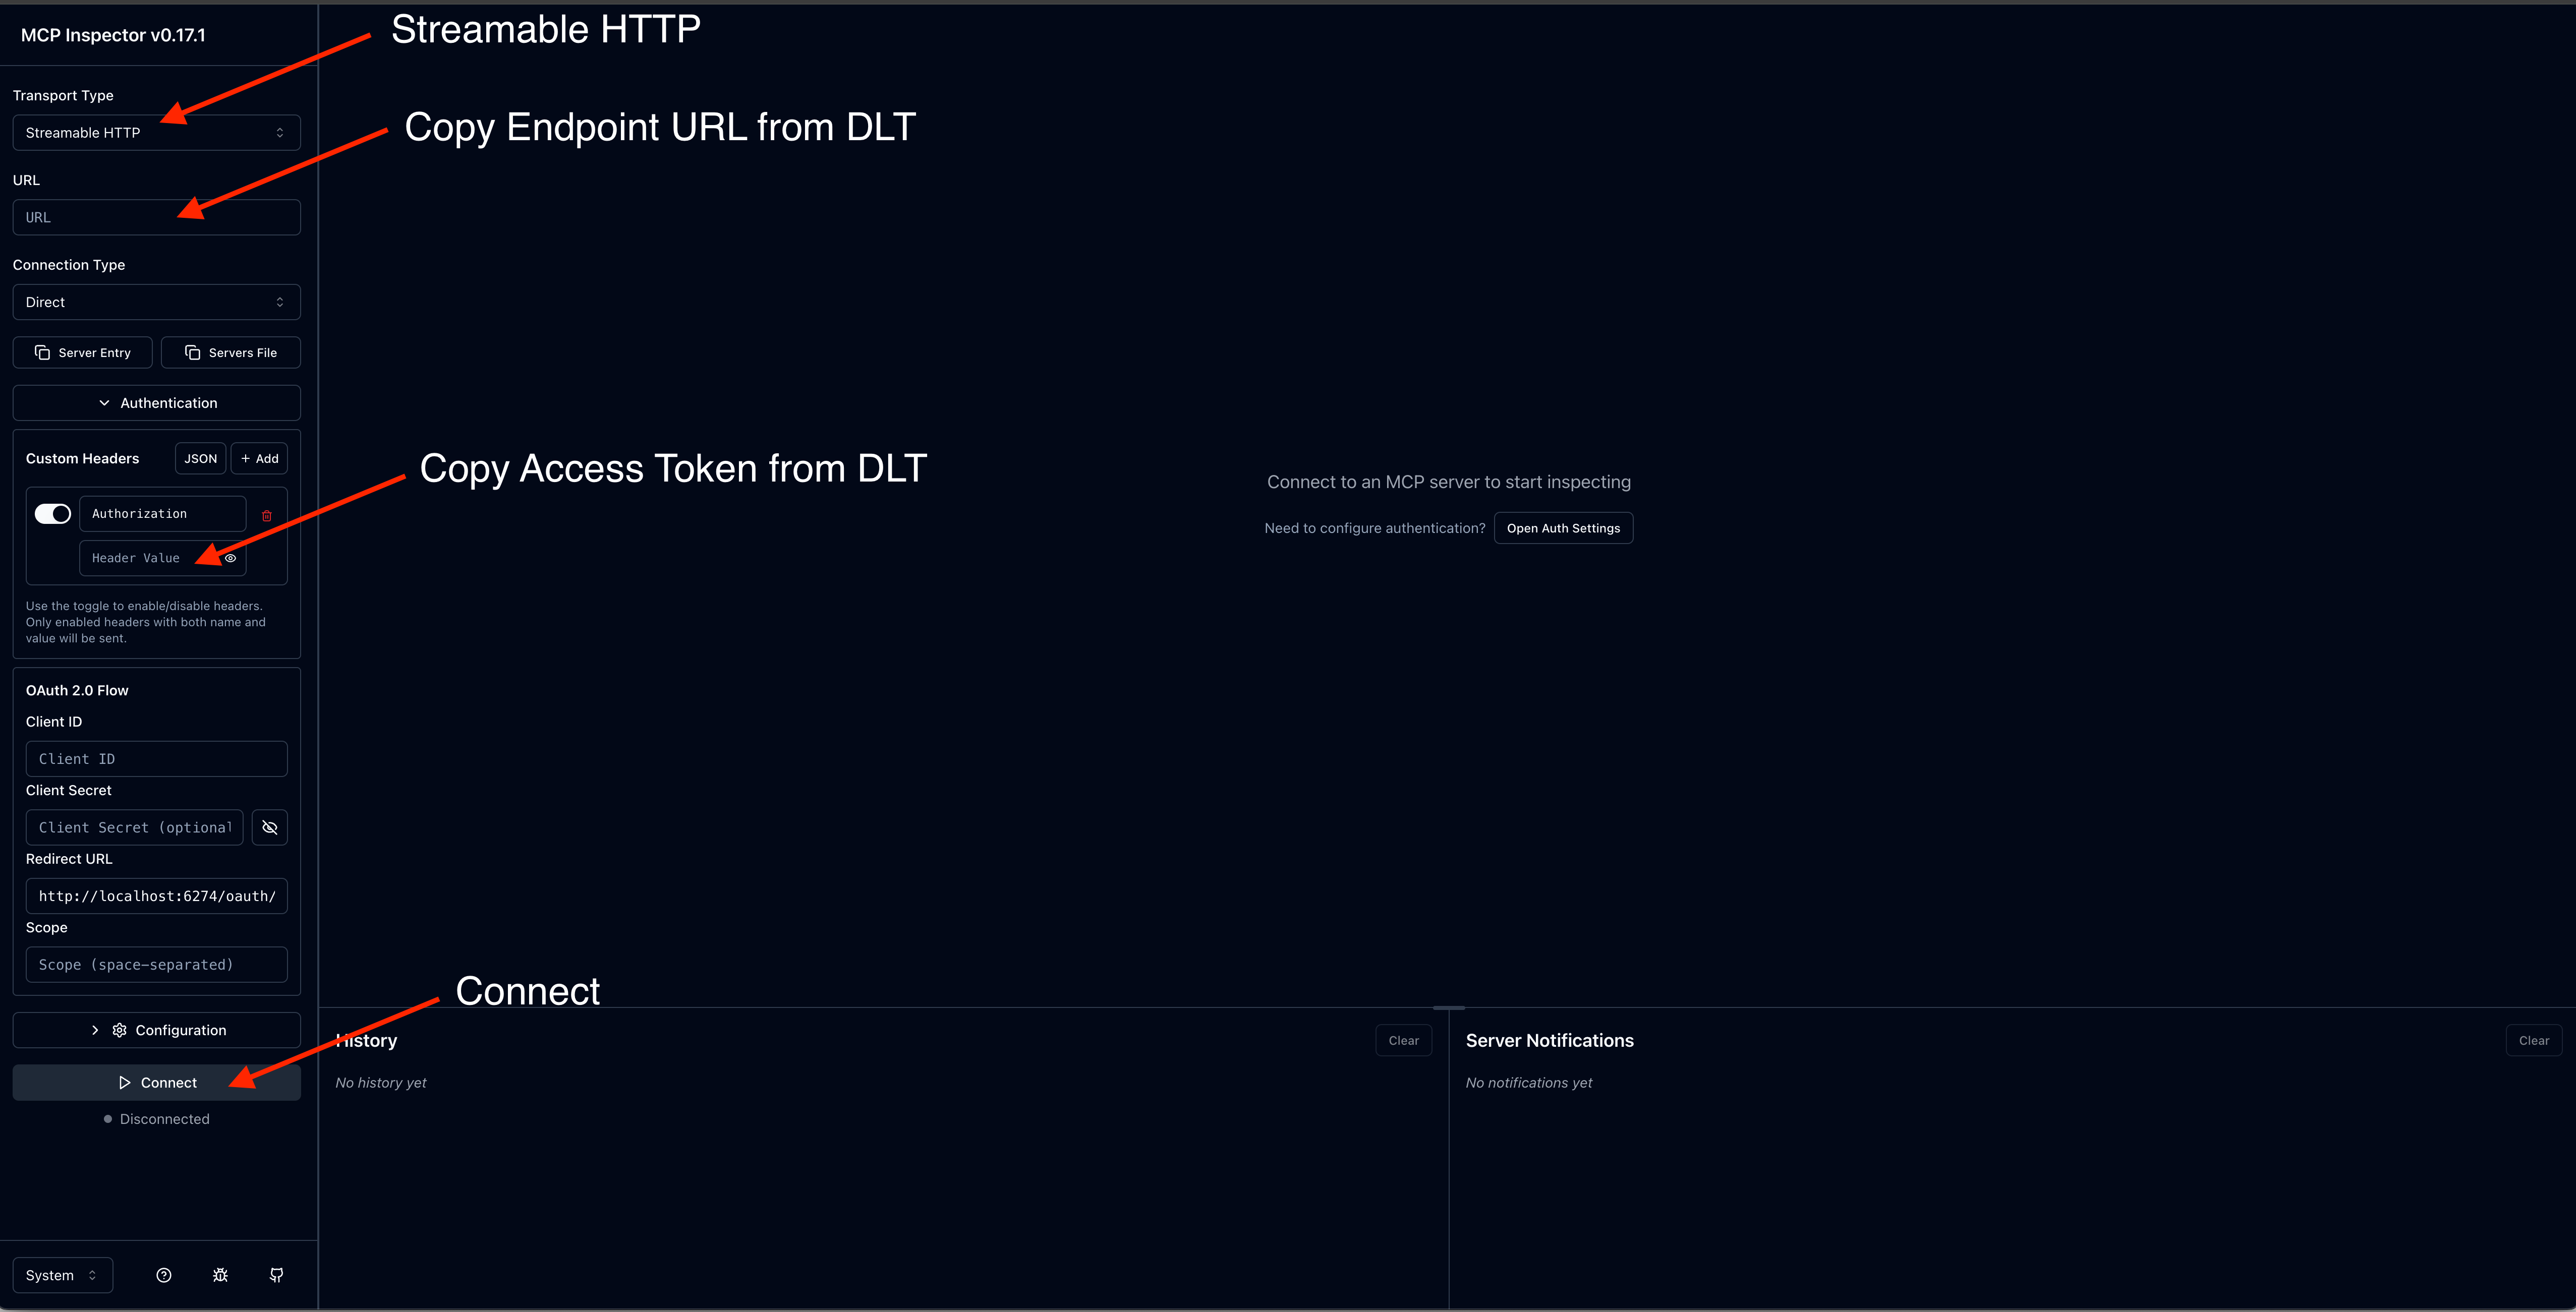
接続を設定する
-
MCP Inspector インターフェイスで、MCP サーバーエンドポイント URL を入力します。
-
アクセストークンで認可ヘッダーを追加します。
-
[コネクト] を選択して接続を確立します。
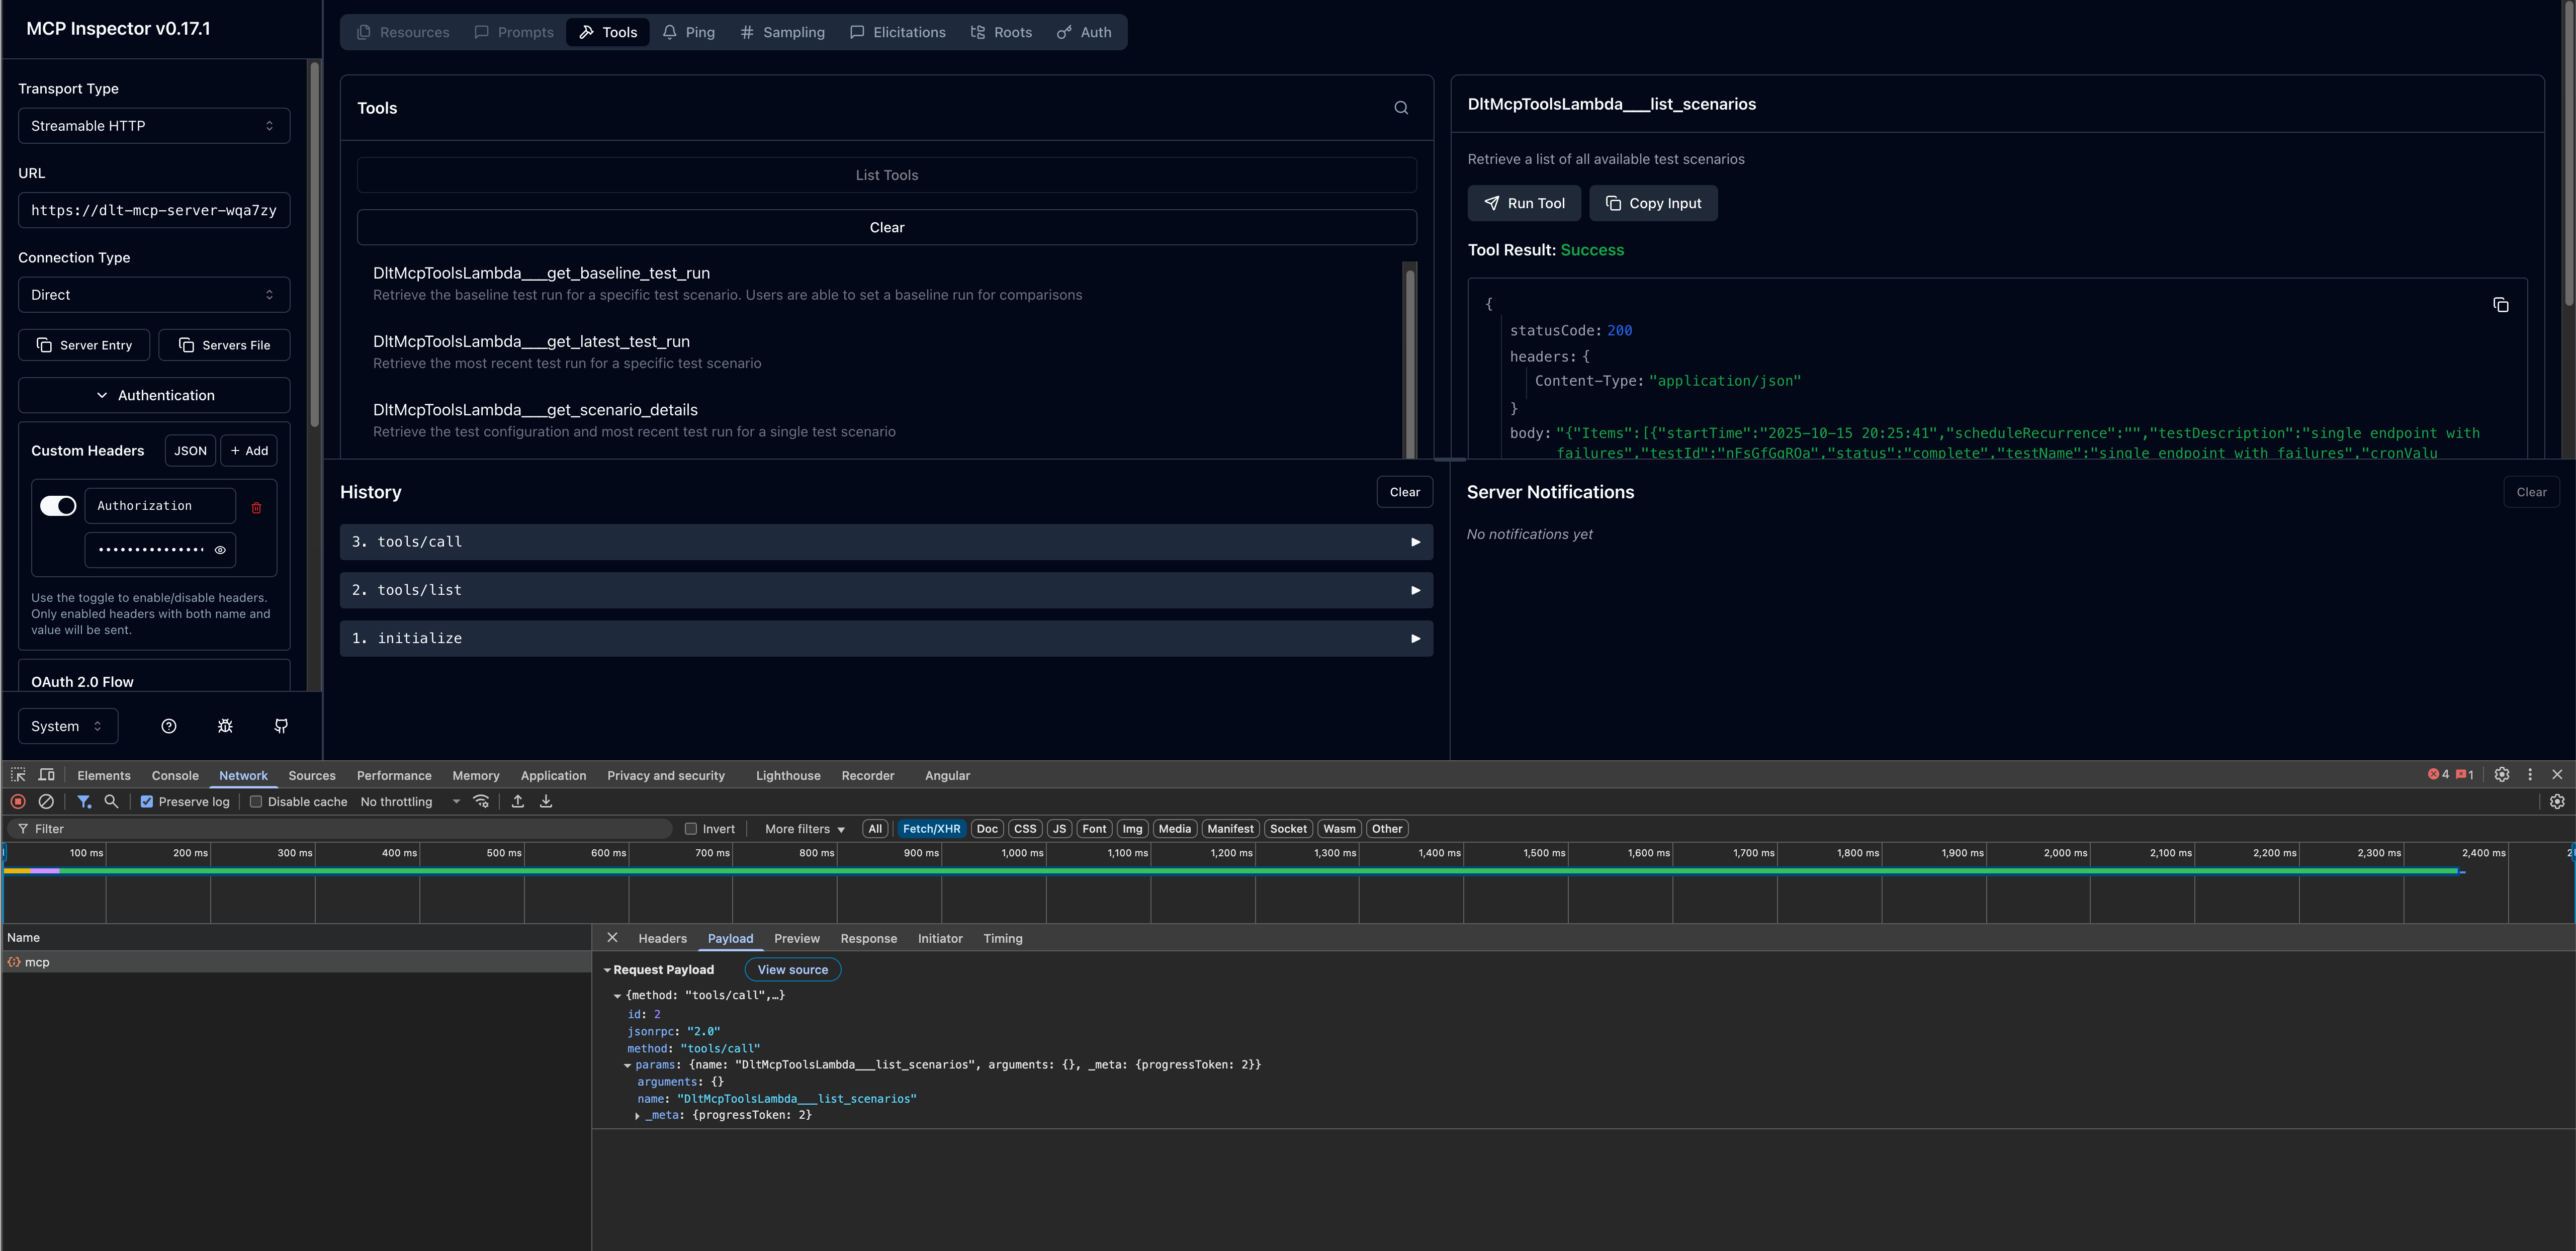
ツールを呼び出す
接続したら、利用可能な MCP ツールをテストできます。
-
左側のパネルで利用可能なツールのリストを参照します。
-
ツール (
list_scenariosなど) を選択します。 -
必要なパラメータを指定します。
-
[呼び出す] を選択してツールを実行し、レスポンスを表示します。
ステップ 3: AI 開発クライアントを設定する
MCP Inspector との MCP サーバー接続を確認したら、希望する AI 開発クライアントを設定できます。
Kiro CLI
Kiro CLI (以前の Amazon Q Developer CLI) は、MCP サーバー統合による AI 支援型開発へのコマンドラインアクセスを提供します。
設定手順
-
mcp.json設定ファイルを編集します。設定ファイルの場所の詳細については、「Kiro CLI ドキュメント」の「モデルコンテキストプロトコル (MCP)」を参照してください。 -
DLT MCP サーバーの設定を追加します。
{
  "mcpServers": {
    "dlt-mcp": {
      "type": "http",
      "url": "https://<gateway-id>.gateway.bedrock-agentcore.<region>.amazonaws.com/mcp",
      "headers": {
        "Authorization": "Bearer <access-token>"
      }
    }
  }
}
<gateway-id> と <region> を MCP サーバーのエンドポイント URL の値に置き換え、<access-token> をステップ 1 でコピーした値に置き換えます。
設定を確認する
-
ターミナルで、
kiro-cliと入力して Kiro CLI を起動します。 -
/mcpと入力すると、利用可能なすべての MCP サーバーが表示されます。 -
/toolsと入力すると、dlt-mcpおよびその他の設定済み MCP サーバーが提供し、使用可能なツールが表示されます。 -
dlt-mcpが正常に初期化されたことを確認します。
Cline
Cline は、MCP サーバー統合をサポートする AI コーディングアシスタントです。
設定手順
-
Cline で、[MCP サーバーの管理] > [設定] > [MCP サーバーを設定] に移動します。
-
cline_mcp_settings.jsonファイルを更新します。{ "mcpServers": { "dlt-mcp": { "type": "streamableHttp", "url": "https://<gateway-id>.gateway.bedrock-agentcore.<region>.amazonaws.com/mcp", "headers": { "Authorization": "Bearer <access-token>" } } } }<gateway-id>と<region>を MCP サーバーのエンドポイント URL の値に置き換え、<access-token>をステップ 1 でコピーした値に置き換えます。 -
設定ファイルを保存します。
-
Cline を再起動して変更を適用します。
Amazon Quick
Amazon Quick (以前の Amazon Quick Suite) は、MCP サーバーアクションをサポートする包括的な AI アシスタントプラットフォームを提供します。
前提条件
Amazon Quick で MCP サーバーを設定する前に、DLT デプロイの Cognito ユーザープールから OAuth 認証情報を取得する必要があります。
-
AWS CloudFormation コンソール
に移動します。 -
分散負荷テストスタックを選択します。
-
[出力] タブで、DLT デプロイに関連付けられた [Cognito ユーザープール ID] を見つけてコピーします。
-
Amazon Cognitoコンソール
に移動します。 -
CloudFormation 出力からユーザープール ID を使用してユーザープールを選択します。
-
左側のナビゲーションで、[アプリケーションの統合] > [アプリケーションクライアント] を選択します。
-
m2m(machine-to-machine) で終わる名前のアプリケーションクライアントを見つけて選択します。 -
アプリケーションクライアントの詳細ページで、[クライアント ID] をコピーします。[クライアントシークレット] を表示するには、[クライアントシークレットを表示] を選択し、値をコピーします。
-
ユーザープールに戻り、[ドメイン] タブからユーザープールドメインを取得します。
-
ドメインの末尾に
/oauth2/tokenを追加して、トークンエンドポイント URL を作成します。
設定手順
-
Amazon Quick で、新しいエージェントを作成するか、既存のエージェントを選択します。
-
DLT MCP サーバーを操作する方法を説明するエージェントプロンプトを追加します。
-
新しいアクションを追加し、[MCP サーバーアクション] を選択します。
-
MCP サーバーの詳細を設定します。
-
MCP サーバー URL: DLT MCP エンドポイント
-
認証タイプ: サービスベースの認証
-
トークンエンドポイント: Cognito トークンエンドポイント URL
-
クライアント ID: m2m アプリケーションクライアントからのクライアント ID
-
クライアントシークレット: m2m アプリケーションクライアントからのクライアントシークレット
-
-
MCP サーバーアクション設定を保存します。
-
新しい MCP サーバーアクションをエージェントに追加します。
エージェントを起動してテストする
-
Amazon Quick でエージェントを起動します。
-
自然言語プロンプトを使用してエージェントとの会話を開始します。
-
エージェントは MCP ツールを使用し、負荷テストデータを取得して分析します。
プロンプトの例
次の例は、AI アシスタントとやり取りし、MCP インターフェイスを介して負荷テストデータを分析する方法を示しています。特定のテストニーズに一致するように、テスト ID、日付範囲、基準をカスタマイズします。
使用可能な MCP ツールとそのパラメータの詳細については、「デベロッパーガイド」の「MCP ツールの仕様」を参照してください。
シンプルなテスト結果のクエリ
MCP サーバーとの自然言語でのやり取りは、Show me the load tests that have completed in the last 24 hours with their associated completion status と同じくらいシンプルにすることも、次のような分かりやすいものにすることもできます。
Use list_scenarios to find my load tests. Then use get_latest_test_run to show me the basic execution data and performance metrics for the most recent test. If the results look concerning, also get the detailed performance metrics using get_test_run.
プログレッシブな開示によるインタラクティブなパフォーマンス分析
I need to analyze my load test performance, but I'm not sure which specific tests to focus on. Please help me by:

1. First, use list_scenarios to show me available test scenarios
2. Ask me which tests I want to analyze based on the list you show me
3. For my selected tests, use list_test_runs to get the test run history
4. Then use get_test_run with the test_run_id to get detailed response times, throughput, and error rates
5. If I want to compare tests, use get_baseline_test_run to compare against the baseline
6. If there are any issues, use get_test_run_artifacts to help me understand what went wrong

Please guide me through this step by step, asking for clarification whenever you need more specific information.
本番稼働の準備状況の検証
Help me validate if my API is ready for production deployment:

1. Use list_scenarios to find recent test scenarios
2. For the most recent test scenario, use get_latest_test_run to get basic execution data
3. Use get_test_run with that test_run_id to get detailed response times, error rates, and throughput
4. Use get_scenario_details with the test_id to show me what load patterns and endpoints were tested
5. If I have a baseline, use get_baseline_test_run to compare current results with the baseline
6. Provide a clear go/no-go recommendation based on the performance data
7. If there are any concerns, use get_test_run_artifacts to help identify potential issues

My SLA requirements are: response time under [X]ms, error rate under [Y]%.
パフォーマンスの傾向分析
Analyze the performance trend for my load tests over the past [TIME_PERIOD]:

1. Use list_scenarios to get all test scenarios
2. For each scenario, use list_test_runs with start_date and end_date to get tests from that period
3. Use get_test_run for the key test runs to get detailed metrics
4. Use get_baseline_test_run to compare against the baseline
5. Identify any significant changes in response times, error rates, or throughput
6. If you detect performance degradation, use get_test_run_artifacts on the problematic tests to help identify causes
7. Present the trend analysis in a clear format showing whether performance is improving, stable, or degrading

Focus on completed tests and limit results to [N] tests if there are too many.
失敗したテストのトラブルシューティング
Help me troubleshoot my failed load tests:

1. Use list_scenarios to find test scenarios
2. For each scenario, use list_test_runs to find recent test runs
3. Use get_test_run with the test_run_id to get the basic execution data and failure information
4. Use get_test_run_artifacts to get detailed error messages and logs
5. Use get_scenario_details to understand what was being tested when it failed
6. If I have a similar test that passed, use get_baseline_test_run to identify differences
7. Summarize the causes of failure and suggest next steps for resolution

Show me the most recent [N] failed tests from the past [TIME_PERIOD].
