Le traduzioni sono generate tramite traduzione automatica. In caso di conflitto tra il contenuto di una traduzione e la versione originale in Inglese, quest'ultima prevarrà.
Migra a Ruby OpenTelemetry
Per migrare le applicazioni Ruby da X-Ray SDK alla OpenTelemetry strumentazione, utilizzate i seguenti esempi di codice e le linee guida per la strumentazione manuale.
Sections
Strumenta manualmente le tue soluzioni con l'SDK
- Tracing setup with X-Ray SDK
-
X-Ray SDK for Ruby richiedeva la configurazione del codice con i plug-in di servizio.
require 'aws-xray-sdk' XRay.recorder.configure(plugins: [:ec2, :elastic_beanstalk]) - Tracing setup with OpenTelemetry SDK
-
Nota
Il campionamento remoto a raggi X non è attualmente disponibile per la configurazione per Ruby. OpenTelemetry
Per un'applicazione Ruby on Rails, inserite il codice di configurazione in un inizializzatore Rails. Per ulteriori informazioni, consulta Nozioni di base su
. Per tutti i programmi Ruby con strumentazione manuale, è necessario utilizzare il metodo per configurare l' OpenTelemetry::SDK.configureSDK Ruby. OpenTelemetryInnanzitutto, installa i seguenti pacchetti:
bundle add opentelemetry-sdk opentelemetry-exporter-otlp opentelemetry-propagator-xrayQuindi, configura l' OpenTelemetry SDK tramite il codice di configurazione che viene eseguito quando il programma viene inizializzato. Si consiglia di configurare i seguenti componenti:
-
OTLP Exporter— Necessario per esportare le tracce nell' CloudWatch agente e OpenTelemetry nel raccoglitore -
An AWS X-Ray Propagator— Necessario per propagare il contesto di traccia ai AWS servizi integrati con X-Ray
require 'opentelemetry-sdk'
require 'opentelemetry-exporter-otlp'

# Import the gem containing the AWS X-Ray for OTel Ruby ID Generator and propagator
require 'opentelemetry-propagator-xray'

OpenTelemetry::SDK.configure do |c|
  c.service_name = 'my-service-name'

  c.add_span_processor(
    # Use the BatchSpanProcessor to send traces in groups instead of one at a time
    OpenTelemetry::SDK::Trace::Export::BatchSpanProcessor.new(
      # Use the default OLTP Exporter to send traces to the ADOT Collector
      OpenTelemetry::Exporter::OTLP::Exporter.new(
        # The OpenTelemetry Collector is running as a sidecar and listening on port 4318
        endpoint:"http://127.0.0.1:4318/v1/traces"
      )
    )
  )

  # The X-Ray Propagator injects the X-Ray Tracing Header into downstream calls
  c.propagators = [OpenTelemetry::Propagator::XRay::TextMapPropagator.new]
end
OpenTelemetry SDKs hanno anche il concetto di strumentazione di libreria. Abilitandoli si creeranno automaticamente degli intervalli per librerie come l'SDK. AWS OpenTelemetry offre la possibilità di abilitare tutte le strumentazioni della libreria o specificare quali strumentazioni della libreria abilitare.
Per abilitare tutte le strumentazioni, installa prima il pacchetto:
opentelemetry-instrumentation-allbundle add opentelemetry-instrumentation-allSuccessivamente, aggiorna la configurazione per abilitare tutte le strumentazioni della libreria come mostrato di seguito:
require 'opentelemetry/instrumentation/all'
...

OpenTelemetry::SDK.configure do |c|
   ...

  c.use_all() # Enable all instrumentations
end
OpenTelemetry SDKs hanno anche il concetto di strumentazione di libreria. Abilitandoli si creeranno automaticamente degli intervalli per librerie come l'SDK. AWS OpenTelemetry offre la possibilità di abilitare tutte le strumentazioni della libreria o specificare quali strumentazioni della libreria abilitare.
Per abilitare tutte le strumentazioni, installa prima il pacchetto:
opentelemetry-instrumentation-allbundle add opentelemetry-instrumentation-allSuccessivamente, aggiorna la configurazione per abilitare tutte le strumentazioni della libreria come mostrato di seguito:
require 'opentelemetry/instrumentation/all' ... OpenTelemetry::SDK.configure do |c| ... c.use_all() # Enable all instrumentations end -
Tracciamento delle richieste in arrivo (strumentazione Rails)
- With X-Ray SDK
-
Con X-Ray SDK, il tracciamento X-Ray viene configurato per il framework Rails al momento dell'inizializzazione.
config/initializers/awsEsempio: _xray.rb
Rails.application.config.xray = { name: 'my app', patch: %I[net_http aws_sdk], active_record: true } - With OpenTelemetry SDK
Innanzitutto, installa i seguenti pacchetti:
bundle add opentelemetry-instrumentation-rack opentelemetry-instrumentation-rails opentelemetry-instrumentation-action_pack opentelemetry-instrumentation-active_record opentelemetry-instrumentation-action_viewSuccessivamente, aggiorna la configurazione per abilitare la strumentazione per la tua applicazione Rails come mostrato di seguito:
# During SDK configuration
OpenTelemetry::SDK.configure do |c|

  ...

  c.use 'OpenTelemetry::Instrumentation::Rails'
  c.use 'OpenTelemetry::Instrumentation::Rack'
  c.use 'OpenTelemetry::Instrumentation::ActionPack'
  c.use 'OpenTelemetry::Instrumentation::ActiveSupport'
  c.use 'OpenTelemetry::Instrumentation::ActionView'

  ...

end
AWS Strumentazione SDK
- With X-Ray SDK
-
Per strumentare AWS le richieste in uscita dall' AWS SDK, ai client AWS SDK viene applicata una patch con X-Ray come nell'esempio seguente:
require 'aws-xray-sdk' require 'aws-sdk-s3' # Patch AWS SDK clients XRay.recorder.configure(plugins: [:aws_sdk]) # Use the instrumented client s3 = Aws::S3::Client.new s3.list_buckets - With OpenTelemetry SDK
AWS SDK for Ruby V3 fornisce supporto per la registrazione e l'emissione di tracce. OpenTelemetry Per informazioni su come configurare un client di servizio, consulta Configurazione delle funzionalità di osservabilità nell' AWS SDK OpenTelemetry for Ruby.
Analisi delle chiamate HTTP in uscita
Quando si effettuano chiamate HTTP a servizi esterni, potrebbe essere necessario strumentare manualmente le chiamate se la strumentazione automatica non è disponibile o non fornisce dettagli sufficienti.
- With X-Ray SDK
-
Per strumentare le chiamate downstream, è stato utilizzato l'X-Ray SDK for Ruby per
net/httpapplicare patch alla libreria utilizzata dall'applicazione:require 'aws-xray-sdk' config = { name: 'my app', patch: %I[net_http] } XRay.recorder.configure(config) - With OpenTelemetry SDK
Per abilitare l'utilizzo OpenTelemetry della
net/httpstrumentazione, installate innanzitutto il pacchetto:opentelemetry-instrumentation-net_httpbundle add opentelemetry-instrumentation-net_httpQuindi, aggiorna la configurazione per abilitare la
net/httpstrumentazione come mostrato di seguito:OpenTelemetry::SDK.configure do |c| ... c.use 'OpenTelemetry::Instrumentation::Net::HTTP' ... end
Supporto alla strumentazione per altre librerie
Puoi trovare l'elenco completo delle strumentazioni di libreria supportate per Ruby sotto. OpenTelemetry opentelemetry-ruby-contrib
In alternativa, puoi cercare OpenTelemetry nel Registro per scoprire se OpenTelemetry supporta la strumentazione. Per ulteriori informazioni, consulta Registry.
Creazione manuale dei dati di traccia
- With X-Ray SDK
-
Utilizzando X-Ray, il
aws-xray-sdkpacchetto richiedeva la creazione manuale dei segmenti e dei relativi sottosegmenti secondari per tracciare l'applicazione. Potresti aver anche aggiunto annotazioni e metadati X-Ray ai tuoi segmenti o sottosegmenti:require 'aws-xray-sdk' ... # Start a segment segment = XRay.recorder.begin_segment('my-service') # Add annotations (indexed key-value pairs) segment.annotations[:user_id] = 'user-123' segment.annotations[:payment_status] = 'completed' # Add metadata (non-indexed data) segment.metadata[:order] = { id: 'order-456', items: [ { product_id: 'prod-1', quantity: 2 }, { product_id: 'prod-2', quantity: 1 } ], total: 67.99 } # Add metadata to a specific namespace segment.metadata(namespace: 'payment') do |metadata| metadata[:transaction_id] = 'tx-789' metadata[:payment_method] = 'credit_card' end # Create a subsegment with annotations and metadata segment.subsegment('payment-processing') do |subsegment1| subsegment1.annotations[:payment_id] = 'pay-123' subsegment1.metadata[:details] = { amount: 67.99, currency: 'USD' } # Create a nested subsegment subsegment1.subsegment('operation-2') do |subsegment2| # Do more work... end end # Close the segment segment.close - With OpenTelemetry SDK
-
È possibile utilizzare intervalli personalizzati per monitorare le prestazioni delle attività interne che non vengono acquisite dalle librerie di strumentazione. Nota che solo gli span di tipo server vengono convertiti in segmenti X-Ray, tutti gli altri intervalli vengono convertiti in sottosegmenti X-Ray. Per impostazione
INTERNALpredefinita, gli intervalli sono.Innanzitutto, crea un Tracer per generare intervalli, che puoi ottenere tramite il metodo.
OpenTelemetry.tracer_provider.tracer('<YOUR_TRACER_NAME>')Ciò fornirà un'istanza Tracer registrata a livello globale nella configurazione dell'applicazione. OpenTelemetry È comune avere un singolo Tracer per un'intera applicazione. Crea un OpenTelemetry tracer e usalo per creare intervalli:require 'opentelemetry-sdk' ... # Get a tracer tracer = OpenTelemetry.tracer_provider.tracer('my-application') # Create a server span (equivalent to X-Ray segment) tracer.in_span('my-application', kind: OpenTelemetry::Trace::SpanKind::SERVER) do |span| # Do work... # Create nested spans of default kind INTERNAL will become an X-Ray subsegment tracer.in_span('operation-1') do |child_span1| # Set attributes (equivalent to X-Ray annotations and metadata) child_span1.set_attribute('key', 'value') # Do more work... tracer.in_span('operation-2') do |child_span2| # Do more work... end end endAggiungere annotazioni e metadati alle tracce con SDK OpenTelemetry
Usa il
set_attributemetodo per aggiungere attributi a ogni intervallo. Nota che per impostazione predefinita, tutti questi attributi span verranno convertiti in metadati nei dati grezzi di X-Ray. Per garantire che un attributo venga convertito in un'annotazione e non in metadati, puoi aggiungere la chiave degli attributi all'elenco degli attributi.aws.xray.annotationsPer ulteriori informazioni, vedere Abilitare le annotazioni X-Ray personalizzate. # SERVER span will become an X-Ray segment tracer.in_span('my-server-operation', kind: OpenTelemetry::Trace::SpanKind::SERVER) do |span| # Your server logic here span.set_attribute('attribute.key', 'attribute.value') span.set_attribute("metadataKey", "metadataValue") span.set_attribute("annotationKey1", "annotationValue") # Create X-Ray annotations span.set_attribute("aws.xray.annotations", ["annotationKey1"]) end
Strumentazione manuale Lambda
- With X-Ray SDK
-
Dopo aver abilitato Active Tracing su Lambda, non sono necessarie configurazioni aggiuntive per utilizzare l'SDK X-Ray. Lambda creerà un segmento che rappresenta l'invocazione del gestore Lambda e potrai creare sottosegmenti o librerie di strumenti utilizzando l'SDK X-Ray senza alcuna configurazione aggiuntiva.
- With OpenTelemetry SDK
Considerate il seguente codice di funzione Lambda di esempio (senza strumentazione):
require 'json'
def lambda_handler(event:, context:)
    # TODO implement
    { statusCode: 200, body: JSON.generate('Hello from Lambda!') }
end
Per strumentare manualmente la tua Lambda, dovrai:
Aggiungi le seguenti gemme per la tua Lambda
gem 'opentelemetry-sdk'
gem 'opentelemetry-exporter-otlp'
gem 'opentelemetry-propagator-xray'
gem 'aws-distro-opentelemetry-exporter-xray-udp'
gem 'opentelemetry-instrumentation-aws_lambda'
gem 'opentelemetry-propagator-xray', '~> 0.24.0' # Requires version v0.24.0 or higher
Inizializza l' OpenTelemetry SDK all'esterno del tuo Lambda Handler. Si consiglia di OpenTelemetry configurare l'SDK con:
-
Un semplice processore Span con un X-Ray UDP Span Exporter per inviare Traces all'endpoint UDP X-Ray di Lambda
-
Un propagatore Lambda a raggi X
-
service_nameconfigurazione da impostare sul nome della funzione Lambda
-
Nella tua classe Lambda Handler, aggiungi le seguenti righe allo strumento Lambda Handler:
  class Handler
        extend OpenTelemetry::Instrumentation::AwsLambda::Wrap
        ...

        instrument_handler :process
    end
Il codice seguente illustra la funzione Lambda dopo le modifiche richieste. È possibile creare intervalli personalizzati aggiuntivi per completare gli intervalli forniti automaticamente.
require 'json'
require 'opentelemetry-sdk'
require 'aws/distro/opentelemetry/exporter/xray/udp'
require 'opentelemetry/propagator/xray'
require 'opentelemetry/instrumentation/aws_lambda'

# Initialize OpenTelemetry SDK outside handler
OpenTelemetry::SDK.configure do |c|
  # Configure the AWS Distro for OpenTelemetry X-Ray Lambda exporter
  c.add_span_processor(
    OpenTelemetry::SDK::Trace::Export::SimpleSpanProcessor.new(
      AWS::Distro::OpenTelemetry::Exporter::XRay::UDP::AWSXRayUDPSpanExporter.new
    )
  )

  # Configure X-Ray Lambda propagator
  c.propagators = [OpenTelemetry::Propagator::XRay.lambda_text_map_propagator]

  # Set minimal resource information
  c.resource = OpenTelemetry::SDK::Resources::Resource.create({
    OpenTelemetry::SemanticConventions::Resource::SERVICE_NAME => ENV['AWS_LAMBDA_FUNCTION_NAME']
  })
  c.use 'OpenTelemetry::Instrumentation::AwsLambda'
end

module LambdaFunctions
  class Handler
    extend OpenTelemetry::Instrumentation::AwsLambda::Wrap
    def self.process(event:, context:)
      "Hello!"
    end
    instrument_handler :process
  end
end
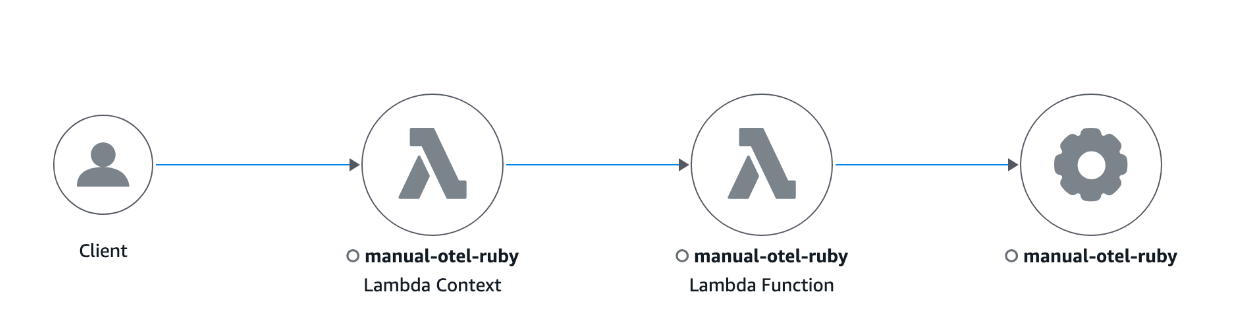
Di seguito è riportato un esempio di mappa di traccia di una funzione Lambda con strumentazione scritta in Ruby.
Puoi anche usare i layer Lambda OpenTelemetry per configurare la tua Lambda. Per ulteriori informazioni, consulta OpenTelemetry AWS-Lambda
