Terjemahan disediakan oleh mesin penerjemah. Jika konten terjemahan yang diberikan bertentangan dengan versi bahasa Inggris aslinya, utamakan versi bahasa Inggris.
Observabilitas dengan Amazon CloudWatch
Gunakan Amazon CloudWatch Container Insights untuk mengumpulkan, menggabungkan, dan meringkas metrik dan log dari aplikasi container dan layanan mikro di klaster EKS yang terkait dengan cluster. HyperPod
Amazon CloudWatch Insights mengumpulkan metrik untuk sumber daya komputasi, seperti CPU, memori, disk, dan jaringan. Wawasan Kontainer juga akan menyediakan informasi diagnostik, seperti kegagalan mengulang kembali kontainer, untuk membantu Anda melakukan isolasi atas masalah dan mengatasi masalah itu dengan cepat. Anda juga dapat menyetel CloudWatch alarm pada metrik yang dikumpulkan Container Insights.
Untuk menemukan daftar metrik lengkap, lihat metrik Amazon EKS dan Kubernetes Container Insights di Panduan Pengguna Amazon EKS.
Instal CloudWatch Wawasan Kontainer
Pengguna admin klaster harus menyiapkan CloudWatch Wawasan Kontainer mengikuti petunjuk di Instal CloudWatch agen dengan menggunakan add-on Amazon CloudWatch Observability EKS atau bagan Helm di Panduan Pengguna. CloudWatch Untuk informasi selengkapnya tentang add-on Amazon EKS, lihat juga Menginstal add-on Amazon CloudWatch Observability EKS di Panduan Pengguna Amazon EKS.
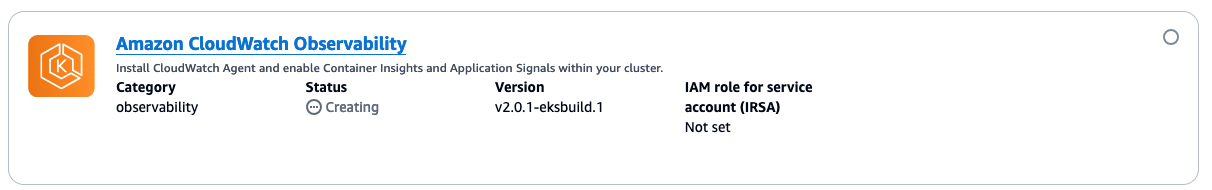
Setelah penginstalan selesai, verifikasi bahwa add-on CloudWatch Observability terlihat di tab add-on cluster EKS. Mungkin perlu waktu sekitar beberapa menit sampai dasbor dimuat.
catatan
SageMaker HyperPod membutuhkan CloudWatch Insight v2.0.1-eksbuild.1 atau yang lebih baru.
Akses log wawasan CloudWatch kontainer
Buka CloudWatch konsol di https://console.aws.amazon.com/cloudwatch/
. -
Pilih Log, lalu pilih Grup log.
Jika HyperPod kluster terintegrasi dengan Amazon CloudWatch Container Insights, Anda dapat mengakses grup log yang relevan dalam format berikut: /aws/containerinsights /<eks-cluster-name>/* Dalam grup log ini, Anda dapat menemukan dan menjelajahi berbagai jenis log seperti log Kinerja, log Host, log Aplikasi, dan log bidang data.
