Fleet Manager console
The Fleet Manager console is a React-based web application built with Cloudscape Design System
Dashboard

The dashboard is the landing page after sign-in. It displays configurable widgets for fleet-wide metrics including vehicle utilization, distance driven, driver safety scores, braking events, battery state of health, and vehicle health status. Operators can add, remove, and rearrange widgets to customize their view. Action buttons provide quick access to the fleet map, simulation, and fleet management.
Fleet management

The fleet management page lists all fleets with their vehicle counts and status. Operators can create new fleets, edit fleet details, associate vehicles (via a selection modal), disassociate vehicles, and delete fleets. Clicking a fleet opens the fleet detail page showing the fleet’s vehicles, active campaigns, and performance summary.

Vehicle management

The vehicle management page displays a searchable, sortable table of all registered vehicles with columns for VIN, status, fleet assignment, and last known location. Operators can create new vehicles (which provisions an IoT certificate and thing in AWS IoT Core), edit vehicle attributes, or delete vehicles.
Vehicle detail

The vehicle detail page is the most information-dense screen in the console. It provides:
-
Live telemetry — Real-time signal values served from the Redis Last Known State cache (see Last Known State pattern). Includes speed, engine RPM, temperatures, tire pressures, battery state, and all other signals from the signal catalog.
-
Trips tab — List of completed and active trips with start/end times, distance, duration, and driver score.
-
Safety events tab — Safety events detected during this vehicle’s trips (see Safety event detection).
-
Remote commands panel — Send actuator commands to the vehicle (lock doors, flash lights, start engine) and view command history with round-trip latency (see Remote commands).
-
Geofence widget — Configure and monitor geofence boundaries for the vehicle.
-
Tire pressure widget — Visual display of per-wheel tire pressure and tread depth.
-
Campaign table — Active FleetWise data collection campaigns targeting this vehicle.
-
FWE log viewer — Stream FleetWise Edge agent logs when running in FWE simulation mode.
Trip detail

The trip detail page shows a completed or active trip with a route map visualization, telemetry timeline, safety events that occurred during the trip, and the driver safety score breakdown. The route is plotted on an Amazon Location Service map using the GPS coordinates stored in the trip’s DynamoDB record (see Trip lifecycle).
Fleet map

The fleet map displays real-time vehicle positions on an interactive map powered by Amazon Location Service. Vehicle locations are read from the Redis geospatial index using GEOSEARCH (see LKS read path). Only vehicles with active trips appear on the map. Clicking a vehicle marker shows a card with current speed, heading, driver, and trip status.
Driver management

The driver management page lists all drivers with their safety scores, trip counts, and fleet assignments. Clicking a driver opens the driver detail page showing trip history, safety event history, and a per-trip score trend.

Safety alerts

The safety alerts page displays all safety events across the fleet in a filterable table. Operators can filter by fleet, vehicle, event type, severity, and time range. Each row shows the event type, severity, vehicle, trip, timestamp, and trigger details. Clicking a row opens a location modal showing where the event occurred on a map. Events are generated by the SafetyProcessor (see Safety event detection).
Service alerts
The service alerts page shows maintenance alerts generated by the MaintenanceProcessor (see Maintenance alert detection). Alerts are displayed with type, severity, vehicle, DTC code, trigger signal, and threshold. Operators can filter by fleet and time range to focus on specific maintenance concerns.
Simulation

The simulation page provides controls to start, configure, and monitor vehicle telemetry simulations. Operators select the number of vehicles, trips per vehicle, city, safety event rate, and telemetry mode (MQTT Direct or FleetWise Edge). Built-in presets (Quick Test, Fleet Demo, Stress Test) provide one-click configurations. The page shows running simulations with status, vehicle count, and elapsed time. For details on how simulation works, see Simulation platform.

From the vehicle detail page, operators can launch a single-vehicle simulation directly. This starts a trip for the selected vehicle without leaving the detail view.

The simulator log viewer streams real-time output from the simulation process, showing telemetry publish events, trip start/end events, and safety event injections.

When running in FleetWise Edge mode, the FWE log viewer streams the agent’s stdout showing MQTT connection status, checkin messages, collection scheme receipts, and CAN signal collection activity.
Data processing
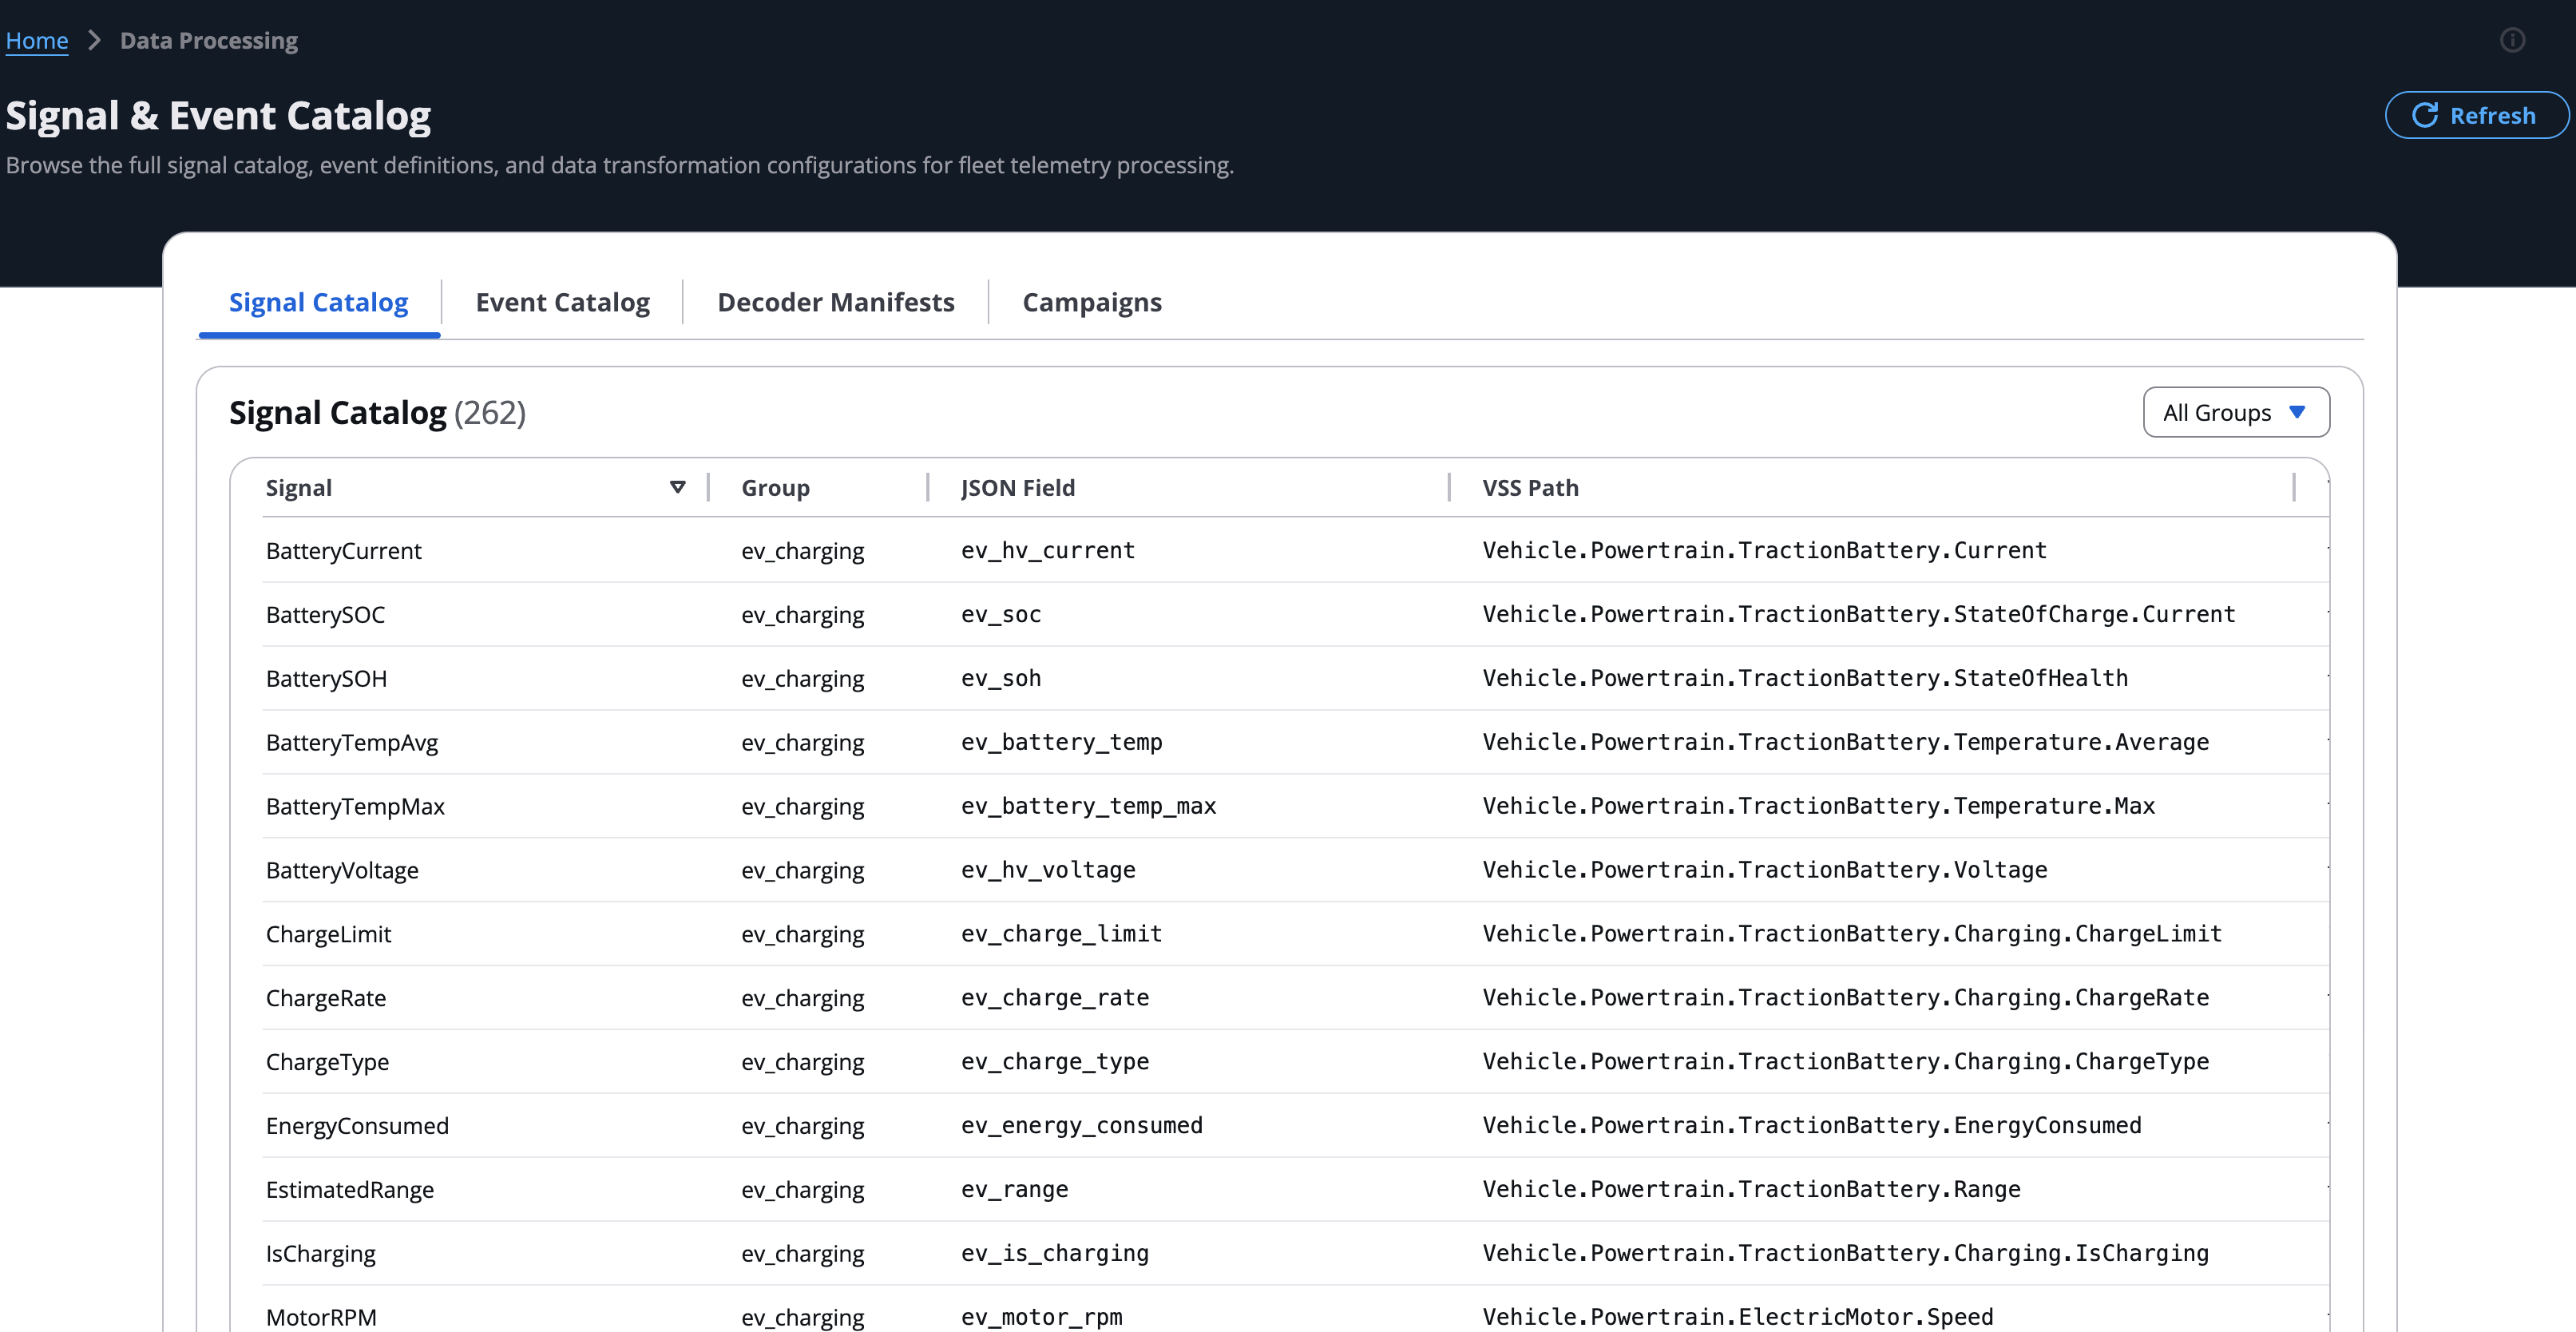
The data processing page provides a read-only browser for the signal catalog, event catalog, decoder manifests, and data transformation configurations. Operators can browse all 260+ signals grouped by category, view signal metadata (VSS path, unit, data type, range), and search for specific signals.

The event catalog viewer displays all safety and maintenance event detection rules with their trigger signals, operators, thresholds, and severity levels. This is the same catalog used by the SafetyProcessor and MaintenanceProcessor Flink applications (see Safety event detection and Maintenance alert detection).

The campaigns view lists all FleetWise data collection campaigns with their status (RUNNING, SUSPENDED, COMPLETED), target vehicles, and signal counts. Operators can create new campaigns, suspend or resume active campaigns, and view campaign details. For details on how campaigns control FWE agent behavior, see Campaigns.

Analytics
The analytics section provides four views:
-
Telemetry dashboard — Real-time and historical telemetry visualization across the fleet.
-
Driver behavior — Driver safety score trends, event frequency analysis, and fleet-wide behavior patterns.
-
Geofence events — Geofence entry/exit events with map visualization.
-
Trip analytics — Trip duration, distance, and efficiency metrics across the fleet.
Settings

The settings page allows operators to configure application preferences including API endpoint, simulation service endpoint, and display options. Dark mode can be toggled from the user dropdown menu (Switch Theme) or the settings page. The theme preference persists across sessions via localStorage.
Profile
The profile page displays the current user’s account details including email, username, role, and account status. Access it from the user dropdown menu in the top navigation bar.
Warranty
The warranty page provides warranty claims management with two views:
-
Warranty-Eligible Failures — Agent-detected component failures that match warranty coverage rules, with confidence scores, estimated claim amounts, and days remaining on coverage.
-
Claim Tracking — Filed claims with status tracking (Submitted, Approved, Paid, Denied), OEM information, and escalation actions for denied claims.
KPIs show total claims, recovered amount year-to-date, open claims, and pending amount. A separate tab tracks recall-related warranty claims.
Driver Assignment
Each vehicle has a default assigned driver shown on the vehicle detail page. Drivers are assigned round-robin from the active driver pool during fleet setup. Fleet managers can reassign drivers from the vehicle detail page. When a trip is detected, it is attributed to the vehicle’s current driver for safety event tracking and driver scoring.
