Ayude a mejorar esta página
Para contribuir a esta guía del usuario, elija el enlace Edit this page on GitHub que se encuentra en el panel derecho de cada página.
Configuración del clúster de Amazon EKS para cargas de trabajo de IA y ML con Terraform
sugerencia
Regístrese
En esta sección, se explican los pasos necesarios para crear la infraestructura necesaria para ejecutar cargas de trabajo de entrenamiento o inferencia en Amazon EKS con Terraform. Los pasos incluyen la creación de un clúster de EKS, nodos habilitados para GPU con el modo automático de EKS o Karpenter, una pila de supervisión con Prometheus y Grafana y almacenamiento en Amazon S3 para el peso de los modelos.
Consulte la documentación del modo automático de EKS y Karpenter
Arquitectura y flujo de trabajo de alto nivel
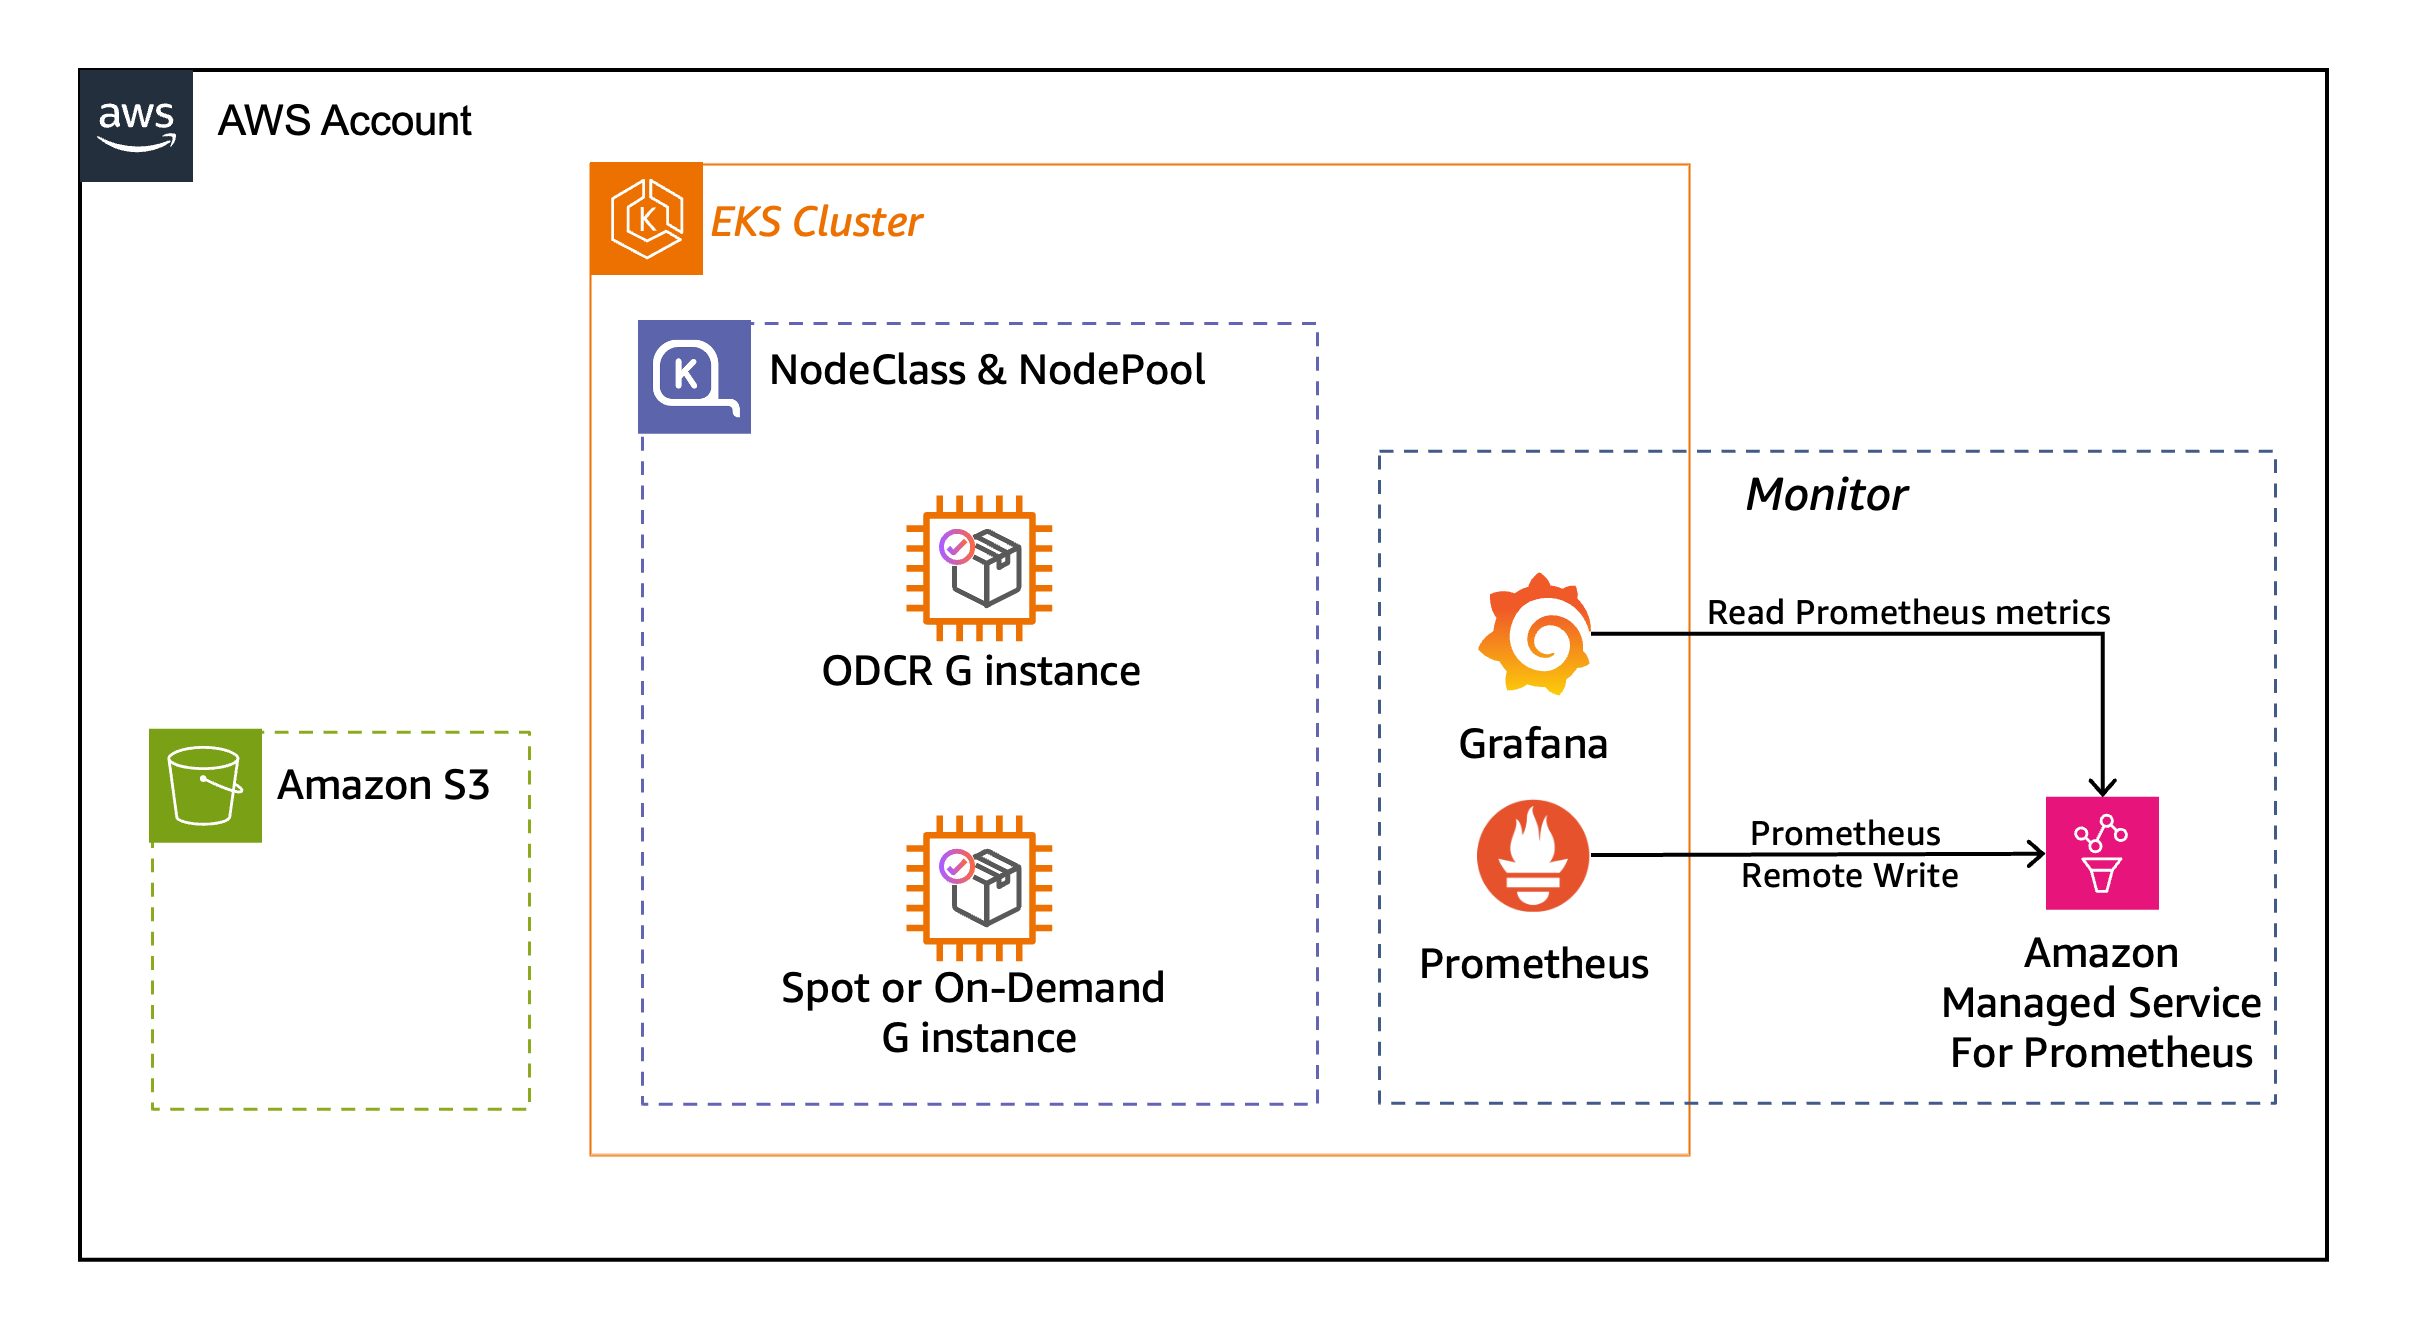
En el diagrama se muestra la arquitectura de alto nivel de AWS para la configuración de esta sección.
Requisitos previos
importante
Los recursos que cree en este tutorial, lo que incluye los clústeres de EKS, las instancias de GPU, los equilibradores de carga de aplicación y Amazon Managed Service para Prometheus, conllevan cargos. Elimine los recursos cuando haya terminado para evitar que se sigan cobrando los cargos.
-
Terraform >= 1.15.0. Para obtener instrucciones de configuración, consulte Instalación de Terraform
. -
kubectl>= 1.36. Para obtener instrucciones de configuración, consulte Configuración de kubectl y eksctl. -
AWS CLI >= 2.27. Para obtener instrucciones de configuración, consulte Instalación.
-
jq. Para obtener instrucciones de configuración, consulte Descarga de jq.
Verifique las versiones de las herramientas:
terraform --version
aws --version
kubectl version --client
jq --version
Paso 1: descarga e implementación del código de Terraform
Este tutorial usa el código de Terraform del repositorio sample-eks-docs
git clone git@github.com:aws-samples/sample-eks-docs.git
cd sample-eks-docs/ai-ml/set-up-cluster
El repositorio tiene la siguiente estructura en el directorio ai-ml/set-up-cluster/ al que acaba de cambiar:
set-up-cluster/
├── scripts/
│   └── cleanup.sh
└── terraform/
    ├── auto-mode/
    └── karpenter/
El repositorio proporciona dos rutas de implementación. Elija solo una y utilícela a lo largo de la guía.
-
Modo automático de EKS (
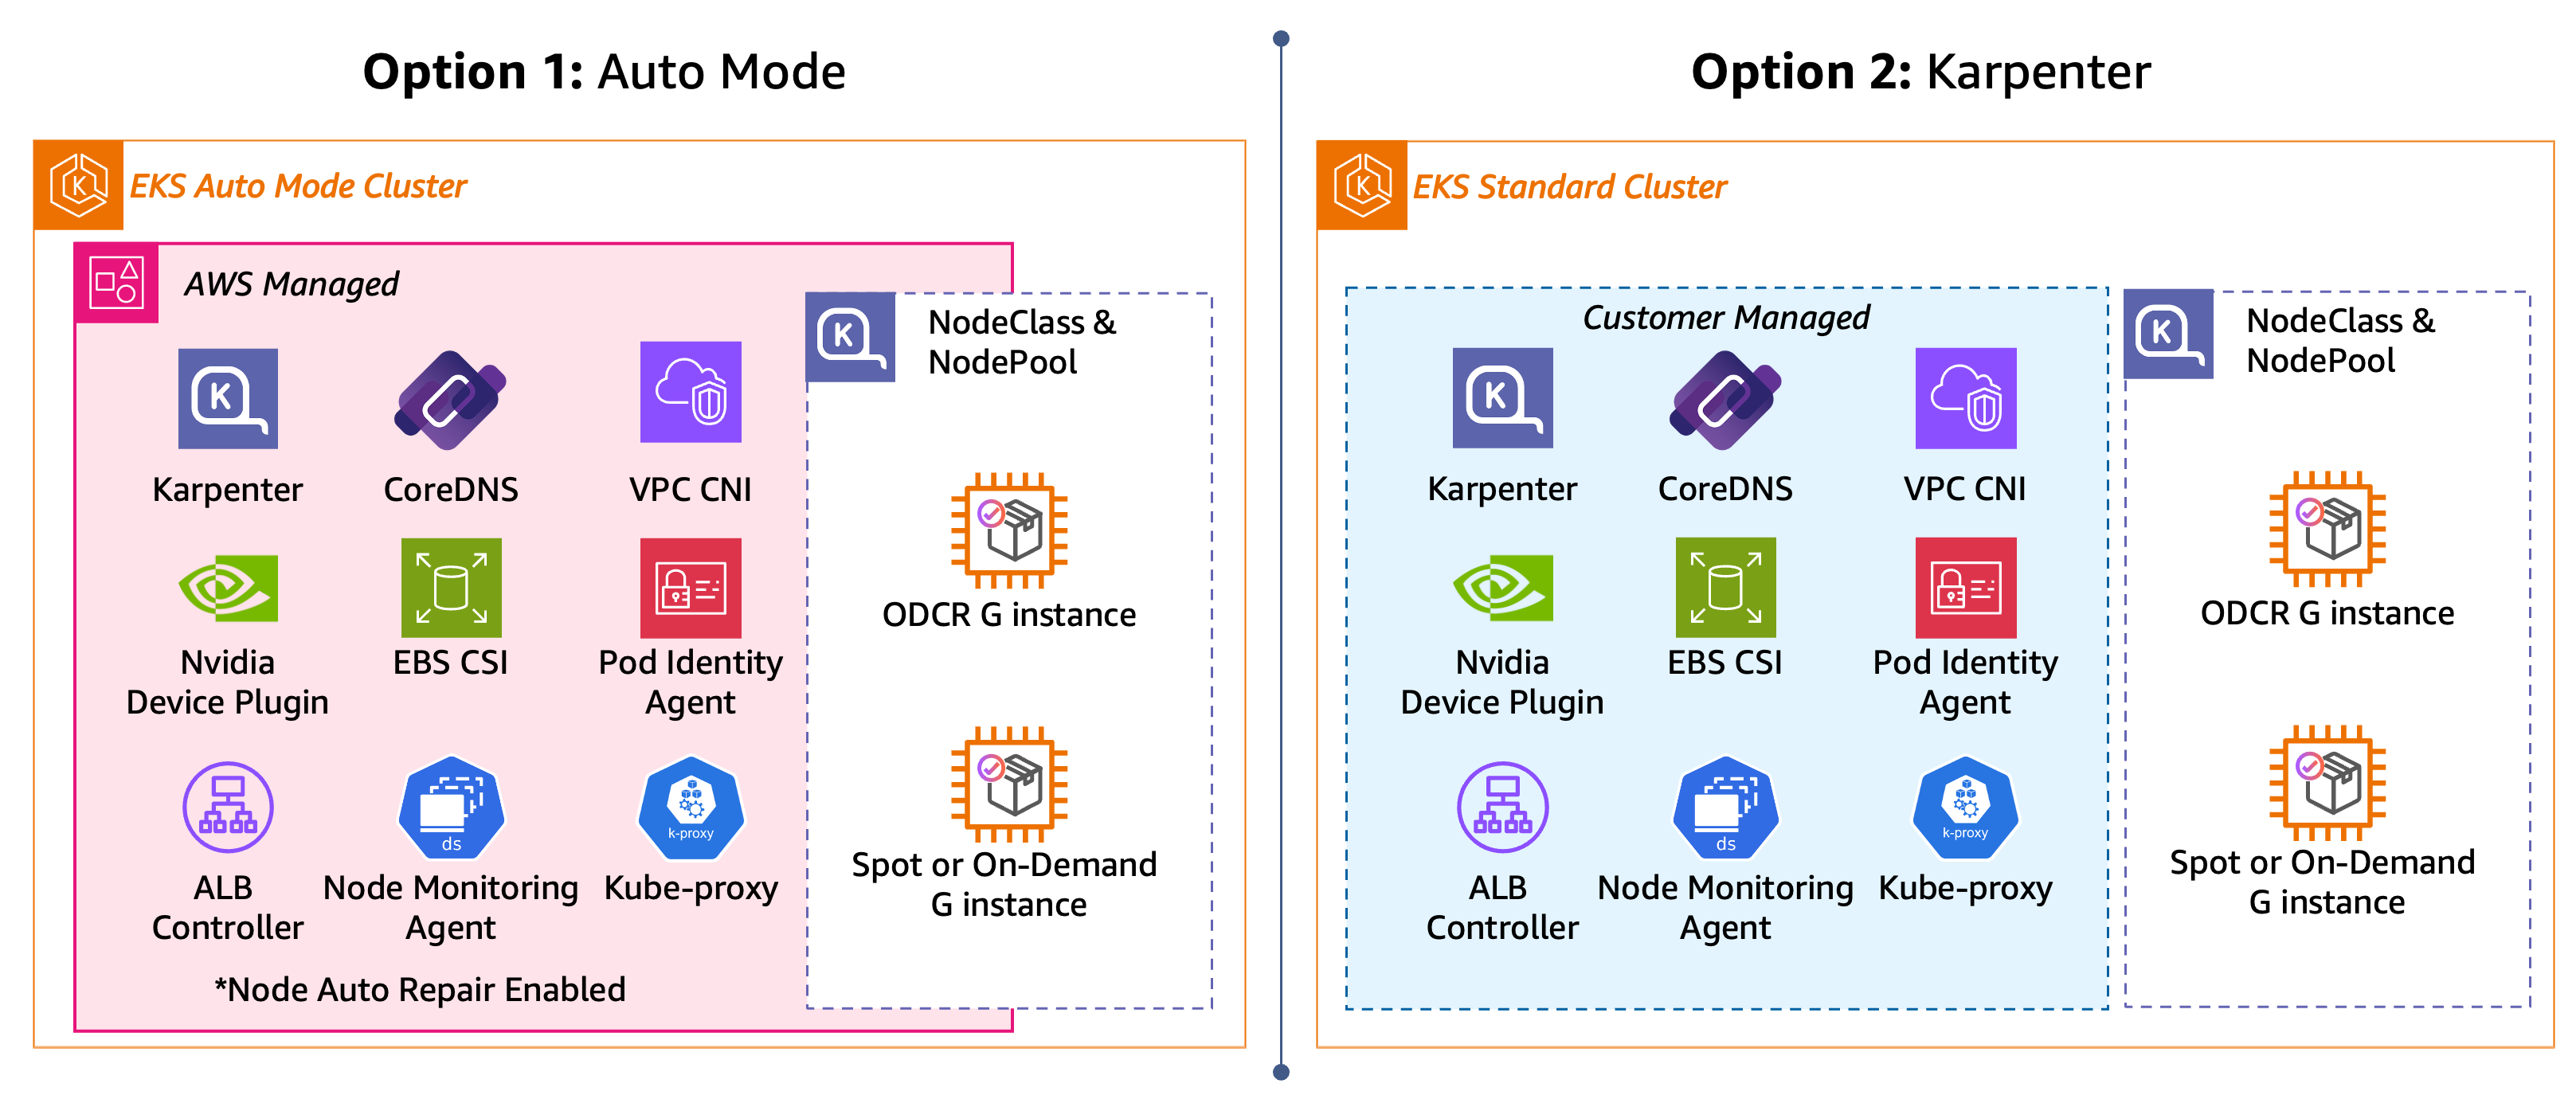
terraform/auto-mode/): además de los complementos de redes, almacenamiento y equilibrio de carga principales, el modo automático de EKS incluye y administra las siguientes capacidades para las cargas de trabajo de entrenamiento e inferencia: agente de supervisión de nodos de EKS, reparación automática de nodos, capturador de instantáneas SOCIpara extraer contenedores rápidamente y preparación de la GPU para la NodeClass predeterminada. El complemento para dispositivos de NVIDIA se incluye en la AMI acelerada de Bottlerocket que utiliza el modo automático de EKS para los nodos habilitados para GPU. -
Karpenter autoadministrado (
terraform/karpenter/): en un clúster de EKS sin el modo automático de EKS, el código de Terraform instala y configura los componentes necesarios para las cargas de trabajo de entrenamiento e inferencia. Esto incluye complementos de red (CNI de VPC, CoreDNS, kube-proxy), Karpenter, el agente de supervisión de nodos de EKS, el complemento para dispositivos de NVIDIA y el capturador de instantáneas SOCI para extraer contenedores rápidamente.
importante
Elija el modo automático de EKS o Karpenter autoadministrado y utilícelo durante toda la guía. Para cambiar a media transmisión, es necesario eliminar el clúster y volver a comenzar.
Opciones de clústeres de EKS: modo automático de EKS y Karpenter autoadministrado
Grafana es de acceso público a través de HTTP con las credenciales predeterminadas
La Ingress del ALB de Grafana tiene el valor predeterminado de var.my_cidr 0.0.0.0/0, lo que expone Grafana a la Internet pública a través de HTTP simple con credenciales de administrador predeterminadas. Los escáneres automatizados detectan los equilibradores de carga públicos en cuestión de minutos. Debe restringir el acceso mediante la sustitución de var.my_cidr por su propia dirección IP:
export MY_CIDR="$(curl -s https://checkip.amazonaws.com)/32"
terraform apply -var "my_cidr=${MY_CIDR}"
Trate las listas de permitidos de IP de origen como una protección mínima, no como una completa. Cambie también la contraseña de administrador predeterminada de Grafana después del primer inicio de sesión. Para una posición más sólida, cambie alb.ingress.kubernetes.io/scheme a internal (al que solo se pueda acceder desde su VPC o una VPN conectada) y agregue un certificado TLS.
Implementación del clúster
Cambie al directorio de la ruta elegida, inicialice Terraform y aplique lo siguiente:
Ambas variantes están configuradas de forma predeterminada en la región us-east-2. Para implementar en otra región, agregue -var "region= al comando region-code"terraform apply del siguiente paso, donde region-code es la región de AWS en la que desea implementar.
El código de Terraform utiliza todas las zonas de disponibilidad disponibles en la región de destino, excepto use1-az3, usw1-az2 y cac1-az3 porque Amazon EKS no admite la ubicación de planos de control en esas zonas
Revisión de las salidas de Terraform
Cuando se completa la aplicación, Terraform imprime las siguientes salidas (los valores varían según la configuración):
Apply complete! Resources: 74 added, 0 changed, 0 destroyed.

Outputs:

cluster_name         = "ai-eks-docs"
configure_kubectl    = "aws eks update-kubeconfig --region us-east-2 --name ai-eks-docs --alias ai-eks-docs"
configure_model_bucket = "export MODEL_BUCKET=ai-eks-docs-models-20250612abc1"
model_bucket         = "ai-eks-docs-models-20250612abc1"
node_iam_role_name   = "ai-eks-docs-eks-auto-20250612..."
region               = "us-east-2"
La salida configure_kubectl es un comando listo para ejecutarse que dirige kubectl al clúster. La salida model_bucket contiene el nombre del bucket de S3 para los pesos de los modelos. La salida node_iam_role_name muestra el rol de IAM que utilizan los nodos.
Configuración de kubectl
Dirija kubectl al nuevo clúster. La salida configure_kubectl es un comando listo para ejecutarse:
eval "$(terraform output -raw configure_kubectl)"
Verificación del clúster
Paso 2: creación de NodePool de GPU dinámica
Los NodePools de GPU están registrados. De forma predeterminada, terraform apply crea el clúster y la pila de supervisión sin capacidad de GPU ni facturación por GPU. Para aprovisionar nodos de GPU, pase la variable nodepools con un nombre de estrategia.
Habilite la estrategia spot-ondemand, que aprovisiona instancias de GPU de la familia G con una generación superior a 4, con capacidad de spot con la opción bajo demanda como alternativa:
terraform apply -var 'nodepools={"spot-ondemand"={}}'
Este comando aplica las plantillas de NodePool y NodeClass del directorio nodepools/spot-ondemand/. Ambas rutas utilizan la misma API de NodePool, pero difieren en la NodeClass a la que hace referencia el NodePool.
Ambas rutas muestran nodos 0 para gpu-inf hasta que se programe una carga de trabajo de GPU. El modo automático de EKS y Karpenter solo lanzan nodos cuando los pods pendientes lo requieren.
Paso 3: prueba con un pod de muestra
Pruebe la configuración de NodePool de GPU con un pod nvidia-smi:
cat << EOF | kubectl apply -f -
apiVersion: v1
kind: Pod
metadata:
  name: nvidia-smi
  labels:
    guide: ai-eks-docs
spec:
  restartPolicy: OnFailure
  tolerations:
    - key: "nvidia.com/gpu"
      operator: "Exists"
      effect: "NoSchedule"
  containers:
    - name: nvidia-smi
      image: public.ecr.aws/amazonlinux/amazonlinux:2023-minimal
      command: ["nvidia-smi"]
      resources:
        limits:
          nvidia.com/gpu: 1
EOF
Verifique que el pod se haya programado y completado correctamente:
kubectl get pods nvidia-smi
Resultado previsto:
NAME         READY   STATUS      RESTARTS   AGE
nvidia-smi   0/1     Completed   0          67s
STATUS: Completed significa que el comando nvidia-smi se ejecutó y cerró. Compruebe los registros del pod para ver la GPU detectada por el nodo:
kubectl logs nvidia-smi
Resultado previsto:
+-----------------------------------------------------------------------------------------+
| NVIDIA-SMI 580.159.03             Driver Version: 580.159.03     CUDA Version: 13.0     |
+-----------------------------------------+------------------------+----------------------+
| GPU  Name                 Persistence-M | Bus-Id          Disp.A | Volatile Uncorr. ECC |
| Fan  Temp   Perf          Pwr:Usage/Cap |           Memory-Usage | GPU-Util  Compute M. |
|                                         |                        |               MIG M. |
|=========================================+========================+======================|
|   0  NVIDIA L4                      On  |   00000000:31:00.0 Off |                    0 |
| N/A   41C    P8             13W /   72W |       0MiB /  23034MiB |      0%      Default |
|                                         |                        |                  N/A |
+-----------------------------------------+------------------------+----------------------+
La salida muestra el modelo de GPU, la versión del controlador, la versión de CUDA y la memoria disponible. En este ejemplo, Karpenter aprovisionó una instancia G6 que tiene una GPU L4 de NVIDIA con 24 GB de memoria. El modelo de GPU y la memoria varía según el tipo de instancia que seleccione Karpenter. Las instancias G5 tienen GPU A10G de NVIDIA (24 GB), las instancias G6 tienen GPU L4 de NVIDIA (24 GB) y las instancias G6e tienen GPU L40S de NVIDIA (48 GB).
Para entender cómo Karpenter y el programador de Kubernetes se coordinaron para aprovisionar un nodo y colocar el pod, compruebe los eventos del ciclo de vida del pod:
kubectl describe pod nvidia-smi
Resultado previsto:
Events:
  Type     Reason            Age   From                   Message
  ----     ------            ----  ----                   -------
  Warning  FailedScheduling  75s   default-scheduler      0/2 nodes are available: 2 node(s) had untolerated taint(s).
  Normal   Nominated         74s   eks-auto-mode/compute  Pod should schedule on: nodeclaim/gpu-inf-z6q75
  Normal   Scheduled         35s   default-scheduler      Successfully assigned default/nvidia-smi to i-0eb897a8302551589
  Normal   Pulling           27s   kubelet                spec.containers{nvidia-smi}: Pulling image "public.ecr.aws/amazonlinux/amazonlinux:2023-minimal"
  Normal   Pulled            22s   kubelet                spec.containers{nvidia-smi}: Successfully pulled image "public.ecr.aws/amazonlinux/amazonlinux:2023-minimal" in 5.625s (5.626s including waiting). Image size: 37440620 bytes.
  Normal   Created           22s   kubelet                spec.containers{nvidia-smi}: Container created
  Normal   Started           21s   kubelet                spec.containers{nvidia-smi}: Container started
Estos eventos muestran la secuencia de programación del pod: el pod inicialmente no se puede programar porque no existen nodos de GPU (FailedScheduling), Karpenter nomina una nueva NodeClaim (Nominated), el programador asigna el pod una vez que el nodo está listo (Scheduled) y, a continuación, se extrae e inicia la imagen del contenedor. El moto automático de EKS tiene la extracción en paralelo de SOCI (Seekable OCI) instalada y configurada de forma predeterminada en las instancias G, P y Trn, y la ruta de Karpenter autoadministrada la configura de forma explícita a través de la puerta de características FastImagePull.
nota
En un clúster de Karpenter autoadministrado, el evento Nominated muestra karpenter/compute en lugar de eks-auto-mode/compute.
NodeClaim es una solicitud que Karpenter crea para aprovisionar un nodo específico. Muestra el tipo de instancia, el tipo de capacidad, la AZ y si el nodo está listo:
kubectl get nodeclaims
Resultado previsto:
NAME            TYPE        CAPACITY   ZONE         NODE                  READY   AGE
gpu-inf-z6q75   g6.xlarge   spot       us-east-2a   i-0eb897a8302551589   True    5m
El tipo de instancia y la AZ varían. Todas las instancias de la familia G con una generación superior a 4 son aptas.
sugerencia
Si no aparece ningún nodo, compruebe si hay errores de capacidad insuficiente:
kubectl get events | grep InsufficientCapacityError
Karpenter almacena en caché las ofertas no disponibles durante 3 minutos. Ampliar los tipos de instancias y las zonas de disponibilidad permitidos en el NodePool aumenta las posibilidades de conseguir capacidad.
nota
Las instancias de spot lanzadas por Karpenter no aparecen en la consola de solicitudes de spot de EC2. Karpenter utiliza la API CreateFleet de EC2 con type: instant. Las instancias aparecen en la consola de instancias de EC2 con un ciclo de vida de spot.
Paso 4: adición de capacidad reservada al NodePool (opcional)
Si bien el NodePool de GPU del paso 2 aprovisiona instancias bajo demanda o de spot de forma dinámica, algunos casos de uso necesitan una capacidad garantizada. Puede crear una reserva de capacidad bajo demanda (ODCR) para garantizar que la capacidad de la GPU esté disponible cuando se necesite.
Con Terraform, un solo comando crea la ODCR, una NodeClass personalizada que hace referencia a la reserva por etiqueta, y actualiza el NodePool para incluir reserved como tipo de capacidad. Terraform etiqueta la ODCR con nodepool=reserved-spot-ondemand y la NodeClass la selecciona con esa etiqueta.
aviso
El siguiente comando crea una ODCR que se factura inmediatamente y se continúa facturando hasta que la elimine con terraform destroy o el script de limpieza, independientemente de si se están ejecutando nodos en ella o no.
Utilice los valores predeterminados (g6e.4xlarge, 1 instancia, primera AZ del clúster):
terraform apply -var 'nodepools={"reserved-spot-ondemand"={reservation={}}}'
Elija el tipo de instancia, el recuento y la AZ:
terraform apply -var 'nodepools={"reserved-spot-ondemand"={reservation={instance_type="g6e.2xlarge",instance_count=1,az="us-east-2a"}}}'
El objeto reservation admite los siguientes campos:
-
instance_type: el tipo de instancia de GPU que se reservará. Valor predeterminado:g6e.4xlarge. -
instance_count: el número de instancias que se reservará. Valor predeterminado:1. -
az: la zona de disponibilidad de la reserva. Predeterminado:""(usa la primera AZ del clúster).
importante
Las estrategias spot-ondemand y reserved-spot-ondemand son mutuamente excluyentes. Puede habilitar como máximo uno de los elementos de la variable nodepools. Si anteriormente utilizó spot-ondemand en el paso 2, el comando reserved-spot-ondemand lo reemplaza porque ambos administran el mismo NodePool gpu-inf.
Si se produce el error InsufficientInstanceCapacity, la reserva no se puede gestionar en la AZ especificada. Cancele la operación de Terraform (Ctrl + C) y vuelva a ejecutarla con un valor de az diferente:
terraform apply -var 'nodepools={"reserved-spot-ondemand"={reservation={instance_type="g6e.4xlarge",az="us-east-2b"}}}'
Tras la aplicación, Terraform actualiza el NodePool para incluir reserved, spot y on-demand en los requisitos de tipo de capacidad. Karpenter considera reserved como la opción más rentable y la lanza primero. Una vez que la reserva esté completa, volverá a ser de spot o bajo demanda.
En la ruta del modo automático de EKS, Terraform crea una NodeClass gpu-inf personalizada (ya que la NodeClass default agrupada es de solo lectura) que hace referencia a la ODCR por etiqueta a través de capacityReservationSelectorTerms. En la ruta autoadministrada de Karpenter, Terraform vuelve a aplicar la EC2NodeClass gpu-inf con capacityReservationSelectorTerms agregado y actualiza el NodePool para incluir reserved.
Verifique que se haya creado la ODCR.
aws ec2 describe-capacity-reservations \
  --filters "Name=state,Values=active" "Name=tag:nodepool,Values=reserved-spot-ondemand" \
  --query 'CapacityReservations[0].{Id:CapacityReservationId,State:State,InstanceType:InstanceType,AvailableCount:AvailableInstanceCount}' \
  --output table \
  --region $(terraform output -raw region)
Verifique que la NodeClass haga referencia a la ODCR:
Verifique que el NodePool esté listo:
kubectl get nodepools gpu-inf
Resultado previsto:
NAME      NODECLASS   NODES   READY   AGE
gpu-inf   gpu-inf     0       True    30s
Tras aplicar los cambios, valide que Karpenter priorice la capacidad reservada y recurra a las opciones de spot o bajo demanda. Implemente una implementación de 2 réplicas que solicite 1 GPU por pod. La ODCR es para 1 instancia (1 GPU), por lo que el primer pod activa Karpenter para lanzar un nodo reservado. El segundo pod no cabe en el nodo reservado y hace que Karpenter lance otro nodo desde la capacidad de spot o bajo demanda.
cat << 'EOF' | kubectl apply -f -
apiVersion: apps/v1
kind: Deployment
metadata:
  name: gpu-overflow-test
  labels:
    guide: ai-eks-docs
spec:
  replicas: 2
  selector:
    matchLabels:
      app: gpu-overflow-test
  template:
    metadata:
      labels:
        app: gpu-overflow-test
        guide: ai-eks-docs
    spec:
      tolerations:
        - key: nvidia.com/gpu
          operator: Exists
          effect: NoSchedule
      containers:
        - name: nvidia-smi
          image: public.ecr.aws/amazonlinux/amazonlinux:2023-minimal
          command: ["sh", "-c", "nvidia-smi && sleep infinity"]
          resources:
            limits:
              nvidia.com/gpu: 1
EOF
A diferencia del pod de prueba nvidia-smi del paso 3 que se ejecutó y cerró, esta implementación mantiene los pods en ejecución (sleep infinity) para que mantengan la GPU e impidan que se consolide el nodo.
Verifique los pods programados en los distintos nodos:
kubectl get pods -l app=gpu-overflow-test -o wide
Resultado previsto:
NAME                                 READY   STATUS    RESTARTS   AGE     IP            NODE                  NOMINATED NODE   READINESS GATES
gpu-overflow-test-55d55ff5b9-dvg52   1/1     Running   0          4m42s   10.0.75.210   i-08741a36089ff2088   <none>           <none>
gpu-overflow-test-55d55ff5b9-hw4m9   1/1     Running   0          4m43s   10.0.82.49    i-0f50cdbacb2017202   <none>           <none>
Compruebe NodeClaims para ver los tipos de capacidad:
kubectl get nodeclaims
Resultado previsto:
NAME            TYPE          CAPACITY   ZONE         NODE                  READY   AGE
gpu-inf-vw99m   g6e.4xlarge   reserved   us-east-2c   i-0f50cdbacb2017202   True    6m
gpu-inf-s65s6   g6.xlarge     spot       us-east-2b   i-08741a36089ff2088   True    5m59s
El nodo reservado se lanzó primero, seguido de un nodo de spot o bajo demanda una vez que se completó la reserva.
Elimine la implementación de prueba:
kubectl delete deployment gpu-overflow-test
Supervisión
Terraform ya aprovisionó toda la pila de supervisión durante terraform apply en el paso 1. La pila incluye un espacio de trabajo de Amazon Managed Service para Prometheus (AMP), políticas de IAM y asociaciones de Pod Identity de EKS para la escritura remota de Prometheus y el acceso a consultas de Grafana, el gráfico de Helm kube-prometheus-stack (Prometheus, Grafana, kube-state-metrics, node-exporter) y el exportador DCGM de NVIDIA para métricas de GPU.
En esta sección, se trata la verificación de los componentes de supervisión implementados.
Verificación de los pods de supervisión
Espere a que estén listos todos los pods de supervisión:
kubectl wait --for=condition=Ready pod --all -n monitoring --timeout=300s
kubectl get pods -n monitoring
Resultado previsto:
NAME                                                       READY   STATUS    RESTARTS   AGE
kube-prometheus-stack-grafana-7c58f54f77-rftrj             3/3     Running   0          5m
kube-prometheus-stack-kube-state-metrics-d68dcbc84-5smxq   1/1     Running   0          5m
kube-prometheus-stack-operator-5895df479f-ttm47            1/1     Running   0          5m
kube-prometheus-stack-prometheus-node-exporter-t9q7s       1/1     Running   0          5m
kube-prometheus-stack-prometheus-node-exporter-x6vfb       1/1     Running   0          5m
prometheus-kube-prometheus-stack-prometheus-0              2/2     Running   0          5m
Acceso a Grafana
Grafana se expone a través de un equilibrador de carga de aplicación (ALB) de AWS orientado a Internet, restringido al CIDR que haya establecido en var.my_cidr. Imprima la URL del equilibrador de carga (espere uno o dos minutos para que el ALB se aprovisione):
echo "http://$(kubectl get ingress kube-prometheus-stack-grafana -n monitoring -o jsonpath='{.status.loadBalancer.ingress[0].hostname}')"
Abra la dirección URL en el navegador. Inicie sesión con el nombre de usuario admin y la contraseña con el siguiente comando:
kubectl --namespace monitoring get secrets kube-prometheus-stack-grafana -o jsonpath="{.data.admin-password}" | base64 -d ; echo
Verificación de la canalización de métricas
Para comprobar que la canalización de métricas funciona de principio a fin:
-
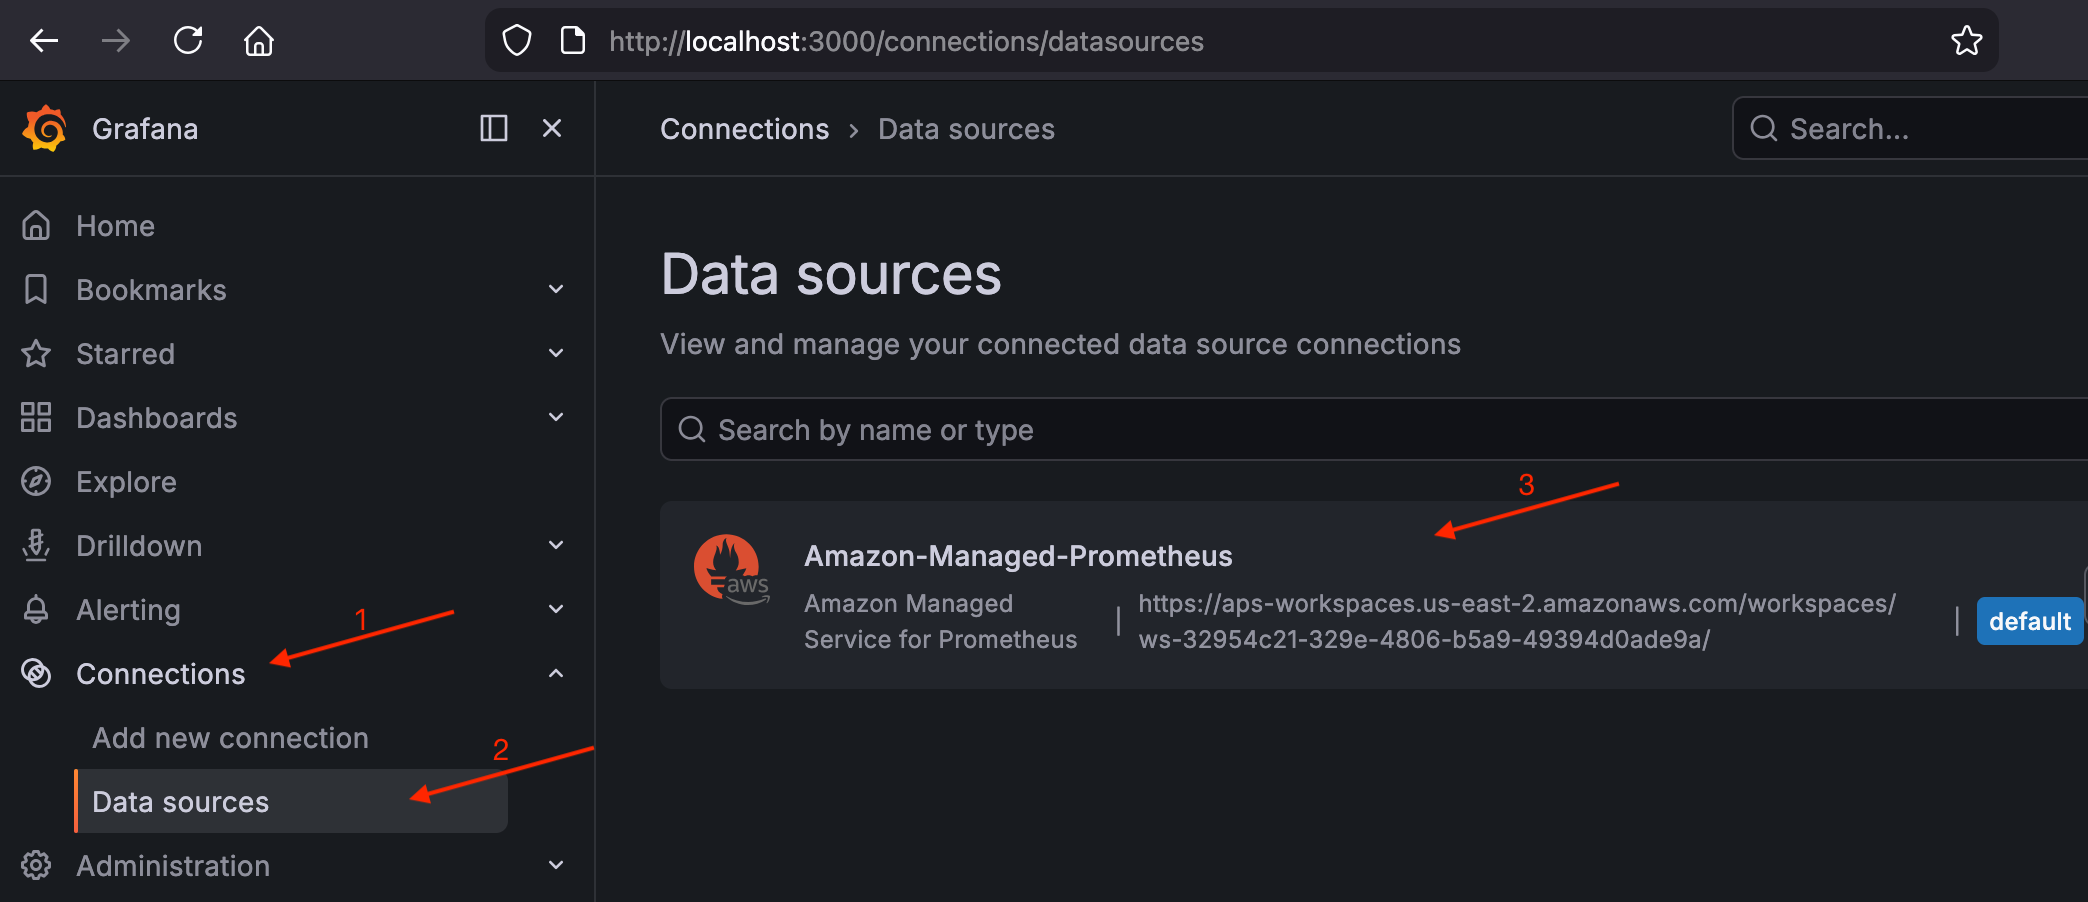
Vaya a Conexiones > Orígenes de datos y confirme que Amazon-Managed-Prometheus aparezca como origen de datos predeterminado.
Validación del origen de datos de AMP en Grafana
-
Vaya a Desglose > Métricas y busque la métrica
up. Debería ver los resultados de los objetivos de raspado del clúster.Validación de la métrica
upen Grafana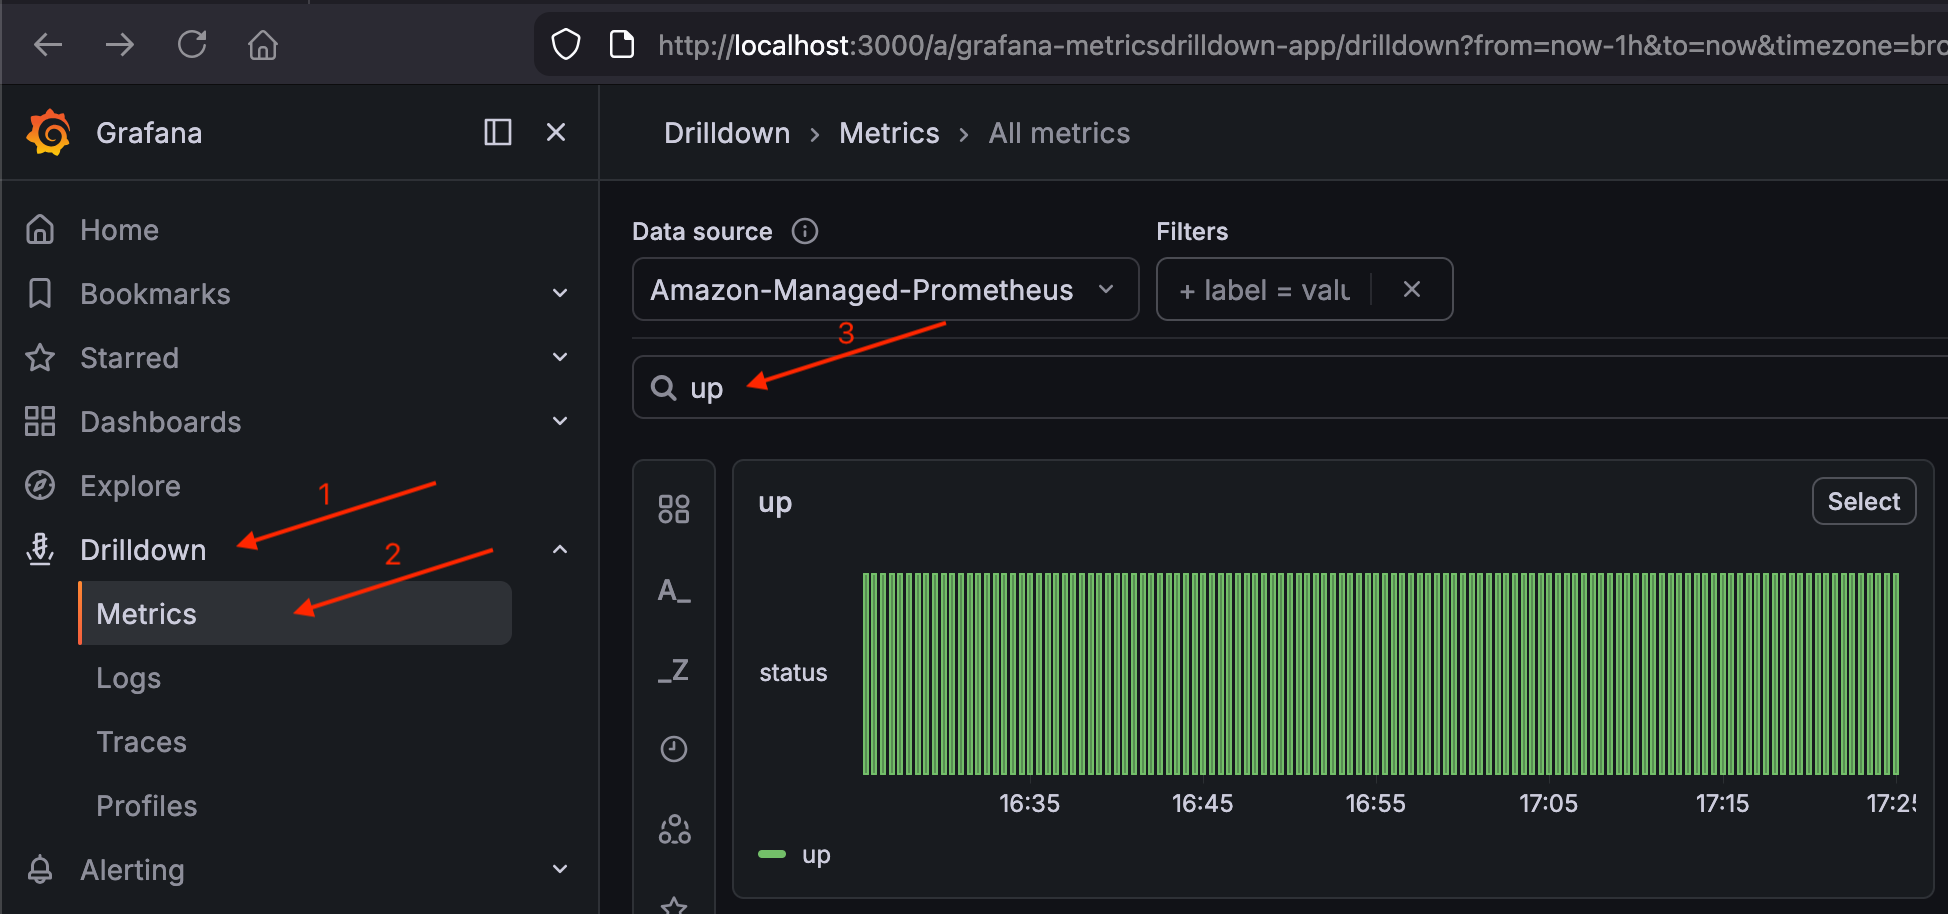
Si up muestra resultados, la canalización (clúster → Prometheus → AMP → Grafana) está funcionando.
Validación de métricas de GPU de DCGM
El DaemonSet del exportador DCGM se ejecuta en nodos de GPU e informa sobre el uso de la GPU, la memoria, la temperatura, el consumo de energía, el ancho de banda de NVLink y las métricas de actividad del tensor.
Verificación del DaemonSet del Exportador DCGM:
kubectl get daemonset dcgm-exporter -n monitoring
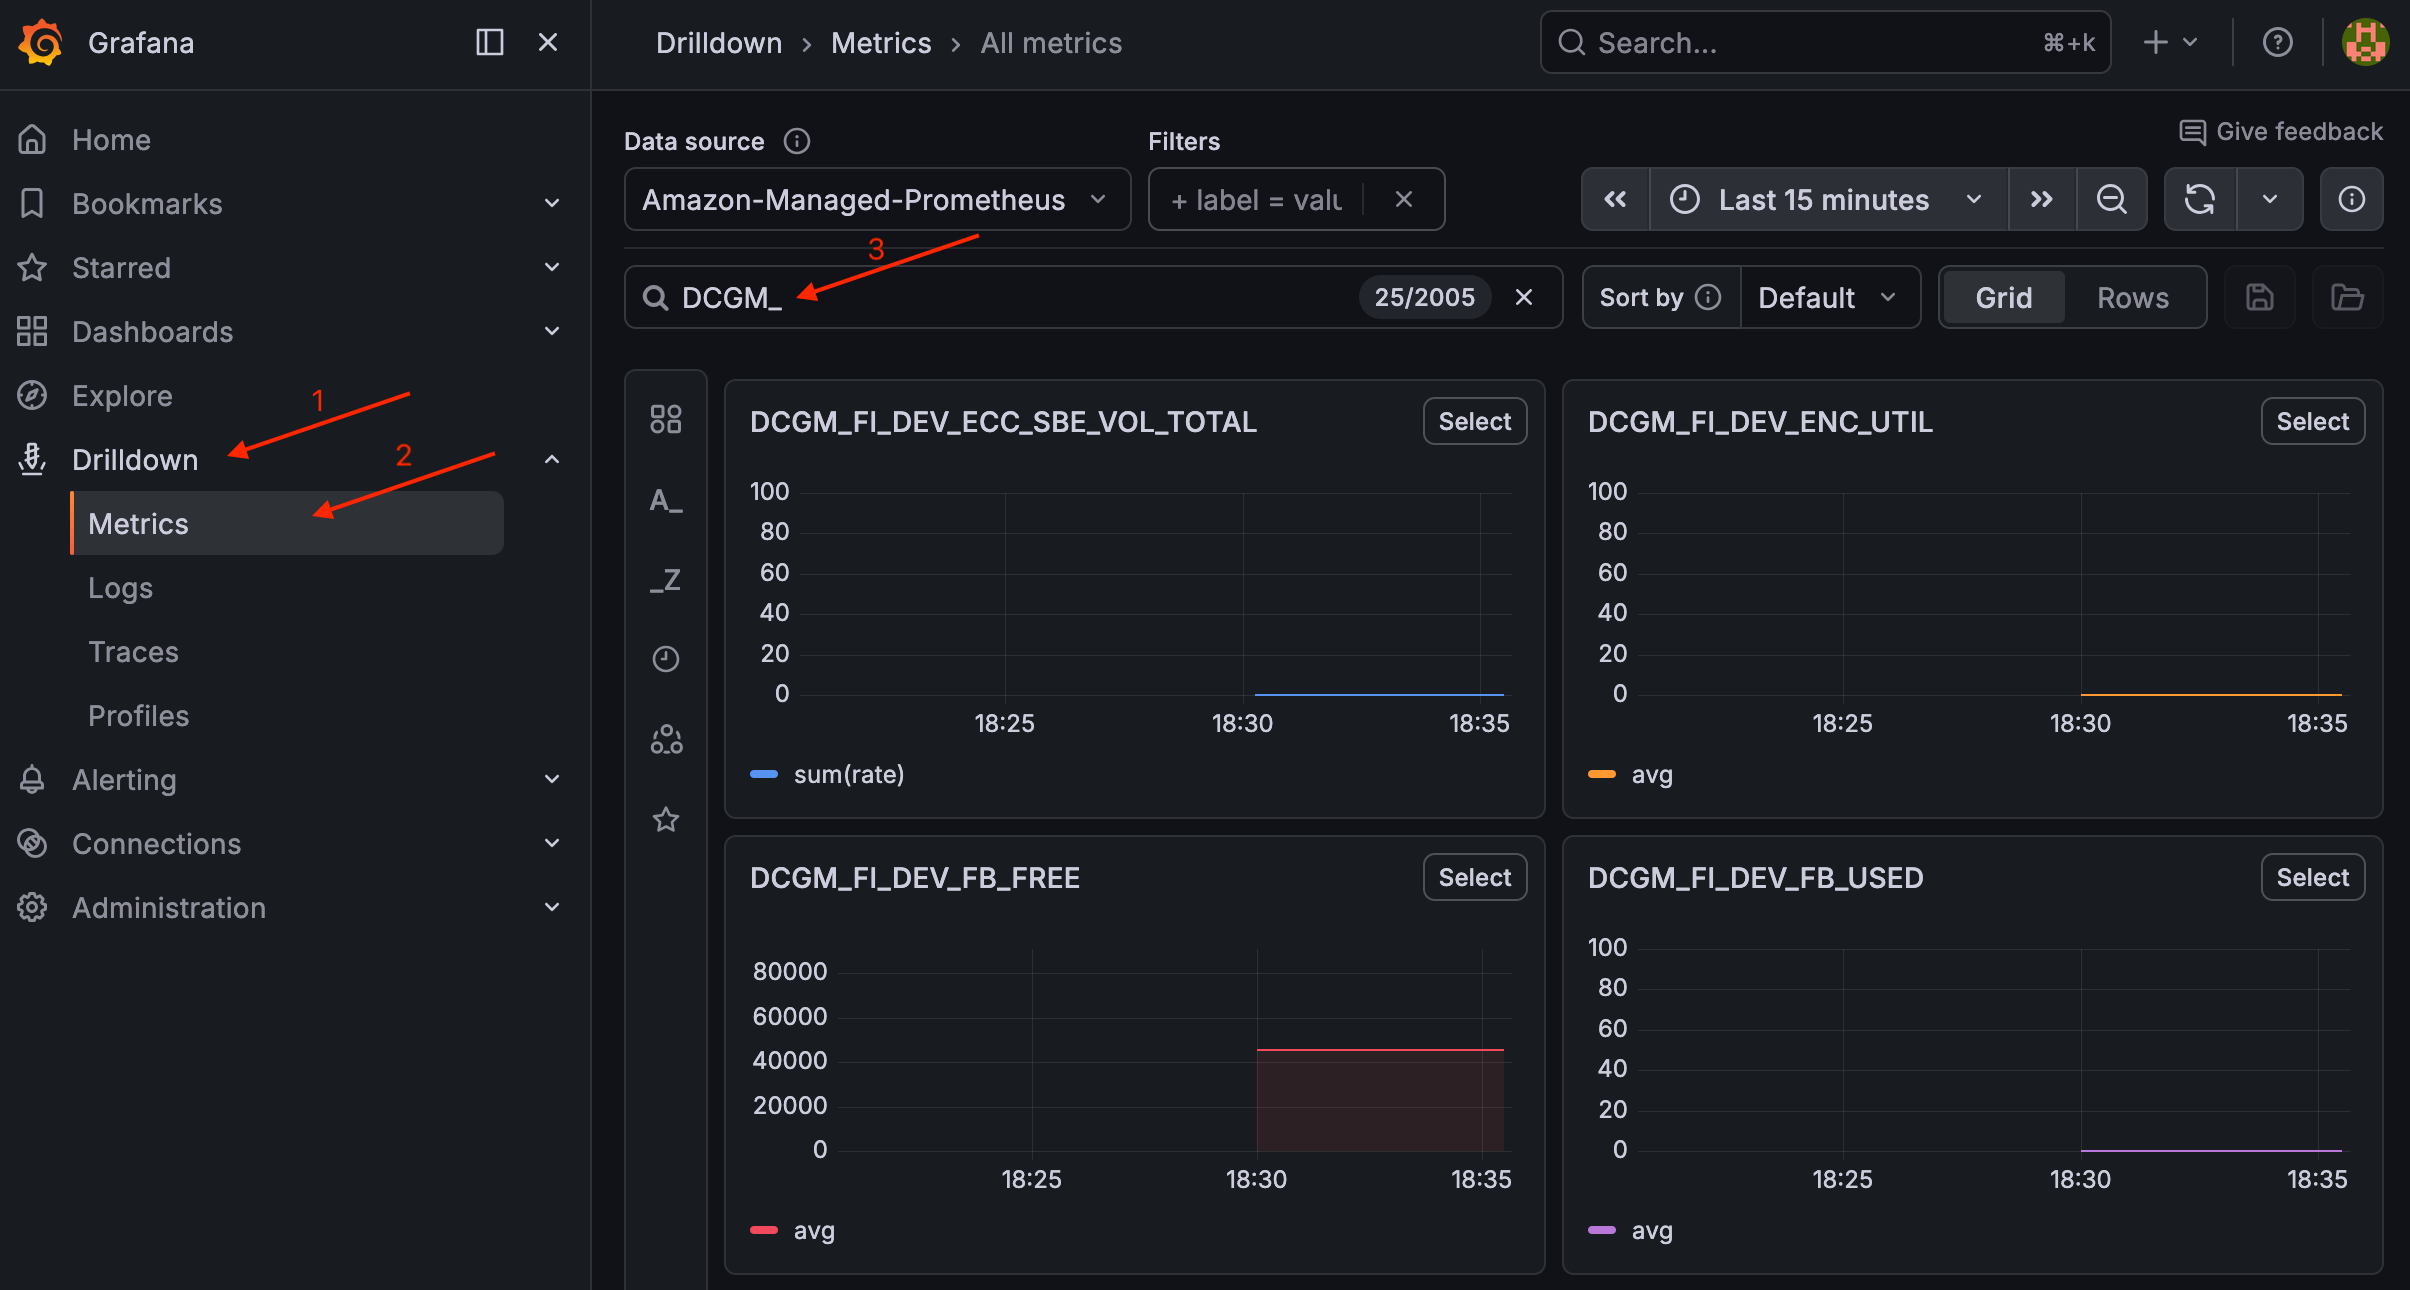
Una vez que el nodo de GPU esté en ejecución (desde el paso 2 o el paso 4), debería ver uno o más pods listos. Para validar las métricas de DCGM, vaya a Desglose > Métricas en Grafana y busque DCGM_.
Validación de las métricas de DCGM en Grafana
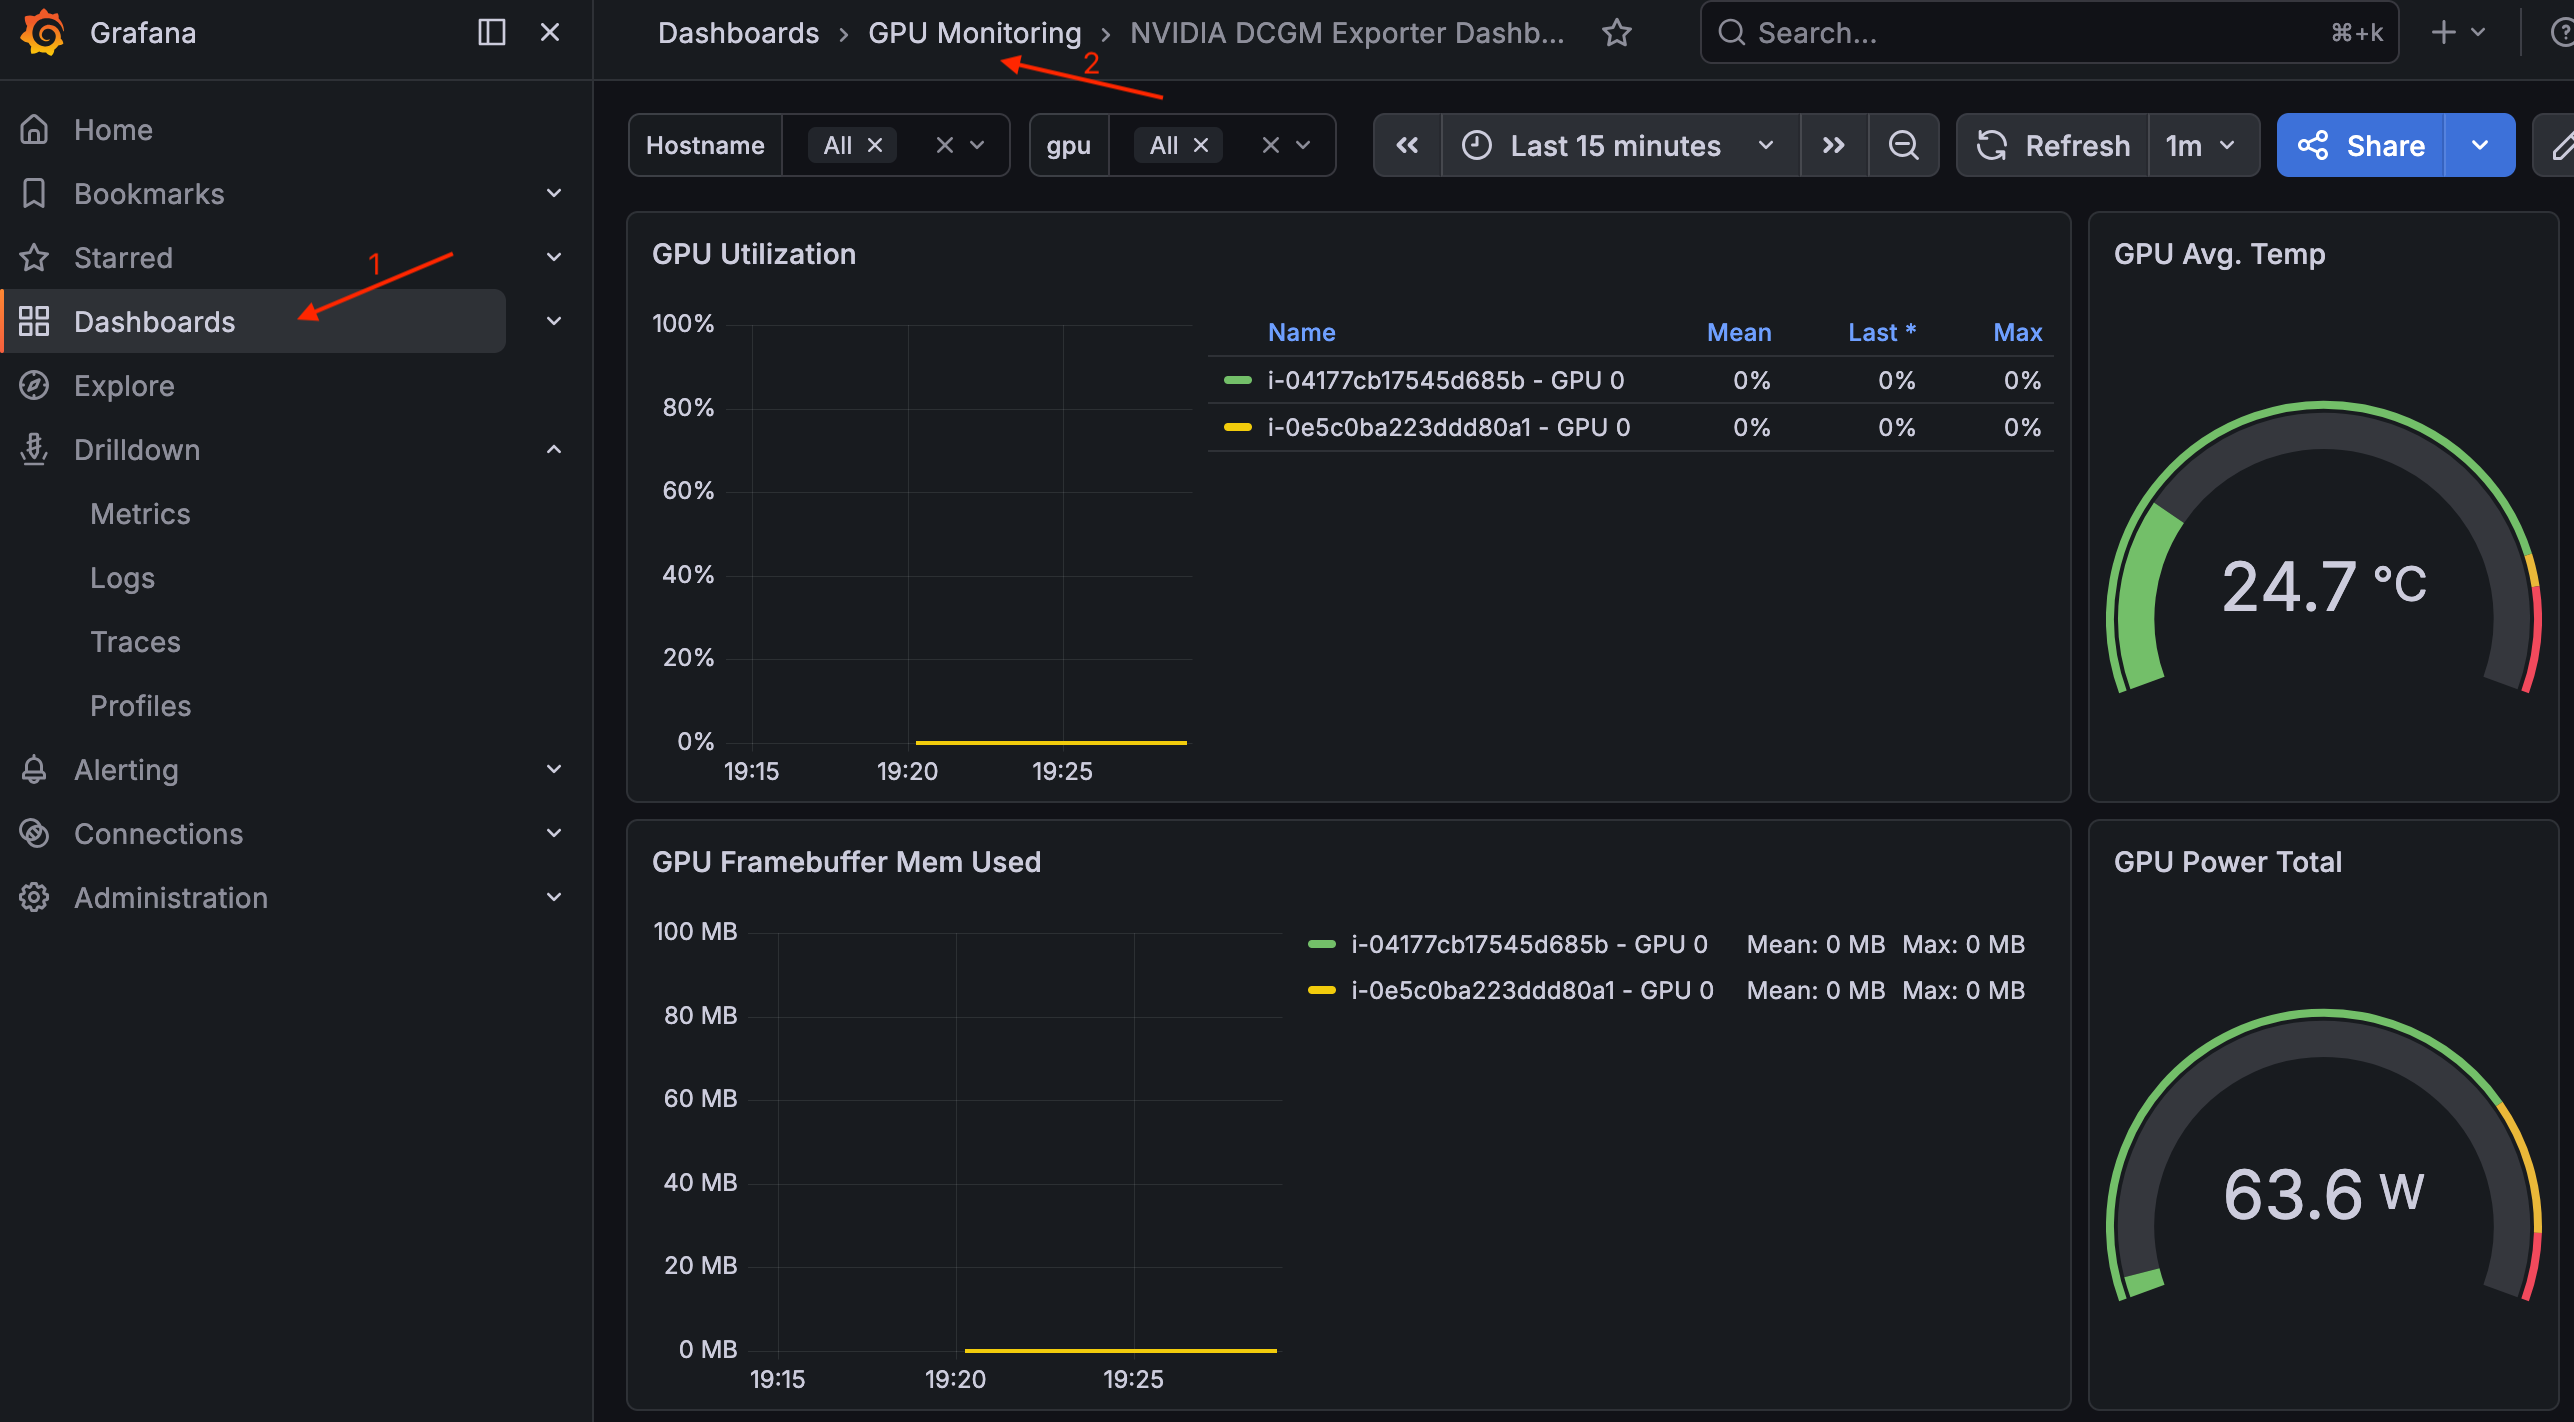
Para ver el panel, vaya a Paneles > Supervisión de GPU > Panel del Exportador DCGM de NVIDIA.
Panel del Exportador DCGM de NVIDIA en Grafana
Bucket de S3 de pesos de los modelos
Terraform ya creó un bucket de Amazon S3 para almacenar los pesos del modelo, una ServiceAccount model-storage-sa en el espacio de nombres default, una política de IAM basada en el bucket y una asociación de Pod Identity de EKS que las vincula. Los pods de carga de trabajo que establezcan serviceAccountName: model-storage-sa podrán leer desde el bucket y escribir en él.
Verificación del bucket
Recupere el nombre del bucket de las salidas de Terraform:
MODEL_BUCKET=$(terraform output -raw model_bucket)
echo ${MODEL_BUCKET}
Verifique que el bucket exista:
aws s3api head-bucket --bucket ${MODEL_BUCKET}
Resultado previsto:
{
    "BucketArn": "arn:aws:s3:::ai-eks-docs-models-20250612abc1",
    "BucketRegion": "us-east-2",
    "AccessPointAlias": false
}
Ejecute un pod único con la imagen de la AWS CLI, mediante la ServiceAccount model-storage-sa, para confirmar que Pod Identity de EKS esté conectado y que el acceso a S3 funcione:
cat << EOF | kubectl apply -f -
apiVersion: v1
kind: Pod
metadata:
  name: s3-test
  labels:
    guide: ai-eks-docs
spec:
  serviceAccountName: model-storage-sa
  containers:
    - name: aws-cli
      image: public.ecr.aws/aws-cli/aws-cli:2.27.0
      command:
        - sh
        - -c
        - |
          echo "=== Caller Identity ==="
          aws sts get-caller-identity
          echo ""
          echo "=== S3 Write Test ==="
          echo "pod identity works" | aws s3 cp - s3://${MODEL_BUCKET}/test.txt
          echo ""
          echo "=== S3 List Test ==="
          aws s3 ls s3://${MODEL_BUCKET}/
          echo ""
          echo "=== S3 Delete Test ==="
          aws s3 rm s3://${MODEL_BUCKET}/test.txt
  restartPolicy: Never
EOF
Espere a que el pod se complete y compruebe los registros:
kubectl wait --for=jsonpath='{.status.phase}'=Succeeded pod/s3-test --timeout=300s
kubectl logs s3-test
Resultado previsto:
=== Caller Identity ===
{
    "UserId": "AROA...:eks-ai-eks-docs-model-s-...",
    "Account": "123456789012",
    "Arn": "arn:aws:sts::123456789012:assumed-role/ai-eks-docs-models-.../eks-ai-eks-docs-..."
}

=== S3 Write Test ===
upload: - to s3://ai-eks-docs-models-20250612abc1/test.txt

=== S3 List Test ===
2026-07-15 12:00:00         19 test.txt

=== S3 Delete Test ===
delete: s3://ai-eks-docs-models-20250612abc1/test.txt
La identidad del intermediario confirma que el pod asumió el rol de almacenamiento del modelo a través de Pod Identity de EKS. Los comandos de S3 confirman el acceso de lectura y escritura.
Elimine el pod de prueba:
kubectl delete pod s3-test
Siguientes pasos
Con el clúster listo, puede pasar al modelo de carga y servicio para implementar un modelo de lenguaje de gran tamaño e interactuar con el punto de conexión de inferencia.
Eliminación
sugerencia
Si planea continuar con las siguientes secciones de esta guía, omita la limpieza completa. Ejecútela solo cuando haya terminado.
Elimine las cargas de trabajo de prueba para que ningún pod contenga nodos de GPU:
kubectl delete pod nvidia-smi --ignore-not-found
kubectl delete deployment gpu-overflow-test --ignore-not-found
Si solo quiere liberar la ODCR y recurrir a la capacidad de spot y bajo demanda, vuelva a cambiar la variable nodepools a la estrategia spot-ondemand:
terraform apply -var 'nodepools={"spot-ondemand"={}}'
Esto quita reserved de los requisitos de tipo de capacidad de NodePool, elimina la ODCR y deja el clúster, la pila de supervisión y el bucket de S3 en su lugar.
importante
La cancelación de una reserva no termina las instancias que ya se ejecutan en ella. Esas instancias continúan en ejecución según las tarifas bajo demanda estándar hasta que se terminan. Elimine antes las cargas de trabajo de GPU, como se muestra anteriormente, para que el nodo reservado se vacíe antes de que se libere la reserva.
Vacíe los nodos administrados por Karpenter antes de eliminarlos, de modo que ningún ciclo de vida de nodo aplicado bloquee la eliminación. Elimine todos los PodDisruptionBudgets que puedan impedir un vaciado y, a continuación, elimine las NodeClaims:
kubectl delete pdb -A --all --ignore-not-found
kubectl delete nodeclaim --all --wait=true --timeout=900s
A continuación, elimine todo lo que creó Terraform, incluido el clúster de EKS, la VPC, la pila de supervisión, los NodePools, las NodeClasses, el bucket del modelo de S3 y cualquier ODCR:
terraform destroy
aviso
El bucket de S3 de pesos del modelo se crea con force_destroy = true, por lo que terraform destroy elimina el bucket junto con los pesos del modelo que haya cargado en él. Copie antes todo lo que desee conservar en otra ubicación.
nota
El repositorio también envía un auxiliar scripts/cleanup.sh que ejecuta los pasos de vaciado y eliminación anteriores y, a continuación, limpia los volúmenes de EBS huérfanos etiquetados con el nombre del clúster. Ejecútelo desde el directorio terraform/<mode>/ desde el que hizo la aplicación y pase --auto-approve para omitir la petición de confirmación de Terraform.
Confirme que no queda ninguna reserva de capacidad activa para el clúster:
aws ec2 describe-capacity-reservations \
  --filters "Name=state,Values=active" "Name=tag:nodepool,Values=reserved-spot-ondemand" \
  --query 'CapacityReservations[].CapacityReservationId' \
  --output text
Un resultado vacío significa que no hay ninguna reserva activa y no se aplican más cargos.
