Save, schedule, and review queries
After you write and run queries, you can save your querybook to the project repository, share it with project members, create schedules to run queries automatically, and review past query executions.
Save a querybook to the project
Querybooks are saved as .sqlnb files in your project repository. Saving makes the querybook available to other project members and preserves it across sessions.
Choose Save in the top-right toolbar.
Enter a name for the querybook.
Choose Save to confirm.

Note
Unsaved querybooks exist only in your current session. If you close the browser without saving, your work is lost.
Share with project members
When you save a querybook to the project, it becomes visible to all project members in the file explorer panel. Other members can open, edit, and run the saved querybook.
To view saved querybooks:
Choose the Querybooks icon in the left panel.
Browse the project repository to find saved .sqlnb files.

Create a schedule
You can schedule a querybook to run automatically at specific times. There are two ways to schedule queries:
From the query editor: Schedule a single querybook directly from the editor interface.
Using workflows: Combine multiple elements (queries, notebooks, ETL jobs) into a single scheduled workflow. For more information, see Serverless workflows.
Schedule from the query editor
Note
You must have a data source connection selected and your querybook must be saved before you can create a schedule. Your project profile must also have scheduling enabled in the Tooling blueprint parameters.
Choose Create schedule in the top-right toolbar.

Under Schedule name, enter a name for the schedule.
Under Schedule status, choose Active (starts running immediately) or Paused (created but does not run until you activate it).
(Optional) Enter a description.
Choose a schedule type: One-time (runs once at a specific date and time) or Recurring (runs on a repeating schedule).
Set the days and times for the schedule to run. You can use a rate-based expression (for example, every 1 hour) or a cron expression for more complex schedules.
Choose Create schedule.

Keep schedules up to date
Enable the project repository auto sync flag when creating or updating your project. This makes scheduled queries always run the latest saved version of the querybook. Test your query in draft mode before saving to avoid running untested SQL on a schedule.
Review and manage scheduled queries
To view your scheduled queries, choose the Scheduled queries icon in the left panel of the query editor.
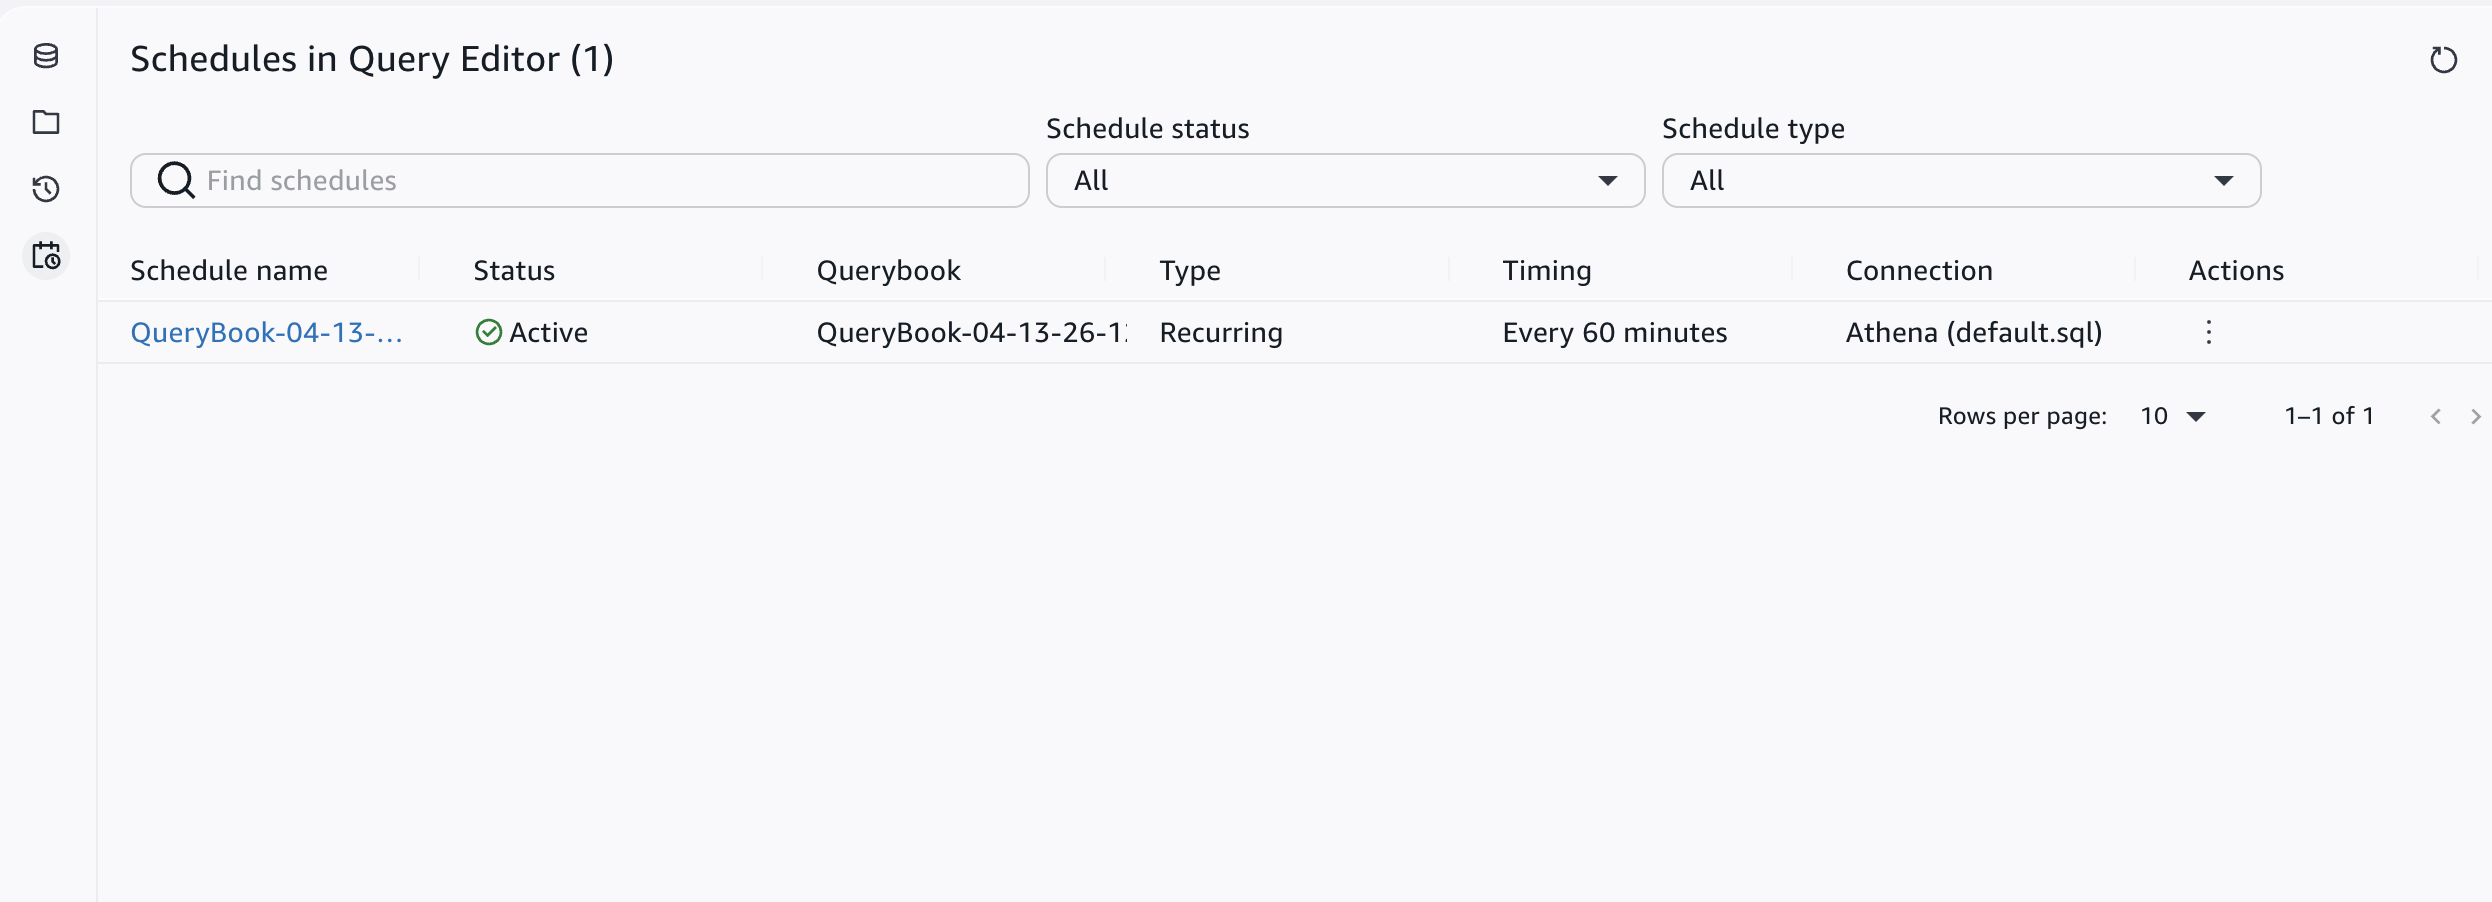
From the scheduled queries page, you can:
| Action | How |
|---|---|
| Pause a schedule | Choose the three-dot menu next to the schedule and choose Pause. |
| Edit a schedule | Choose the three-dot menu and choose Edit. |
| Delete a schedule | Choose the three-dot menu and choose Delete. |
| View run history | Choose the schedule name to see the Runs section with execution history. |
| View run details | In the Runs section, choose a run name to see the querybook output and execution log. |
Review query history
The query history page shows all queries you have run in the query editor, sorted with the most recent queries first. Use it to find past queries, check execution status, review errors, and re-open queries in the editor.
To open the query history page, choose the Query history icon in the left panel of the query editor. Then select a data source to view queries from that source.

Query history columns
| Column | Description |
|---|---|
| Execution ID | A unique identifier for the query execution. Choose the ID to view details. |
| Status | The current state of the query: Completed, Failed, Canceled, or Running. |
| Duration | How long the query took to run. |
| SQL | A preview of the SQL statement. Choose the execution ID to see the full query. |
| Start time | The date and time the query started running. |
| Engine | The query engine used (Amazon Athena or Amazon Redshift). |
Filter query history
You can filter the query history by data source, status, and time range. By default, the page shows queries of all statuses from the past 24 hours.
Filter by status: Choose Status and select a status type (Completed, Failed, Canceled, Running), or choose All to see all statuses.
Filter by time range: Choose Time range, select a predefined range or custom date range, and choose Apply.

View query details
To see the full SQL, execution statistics, and error information for a query:
Choose the Execution ID of the query you want to inspect.
A side panel opens with the full query details.
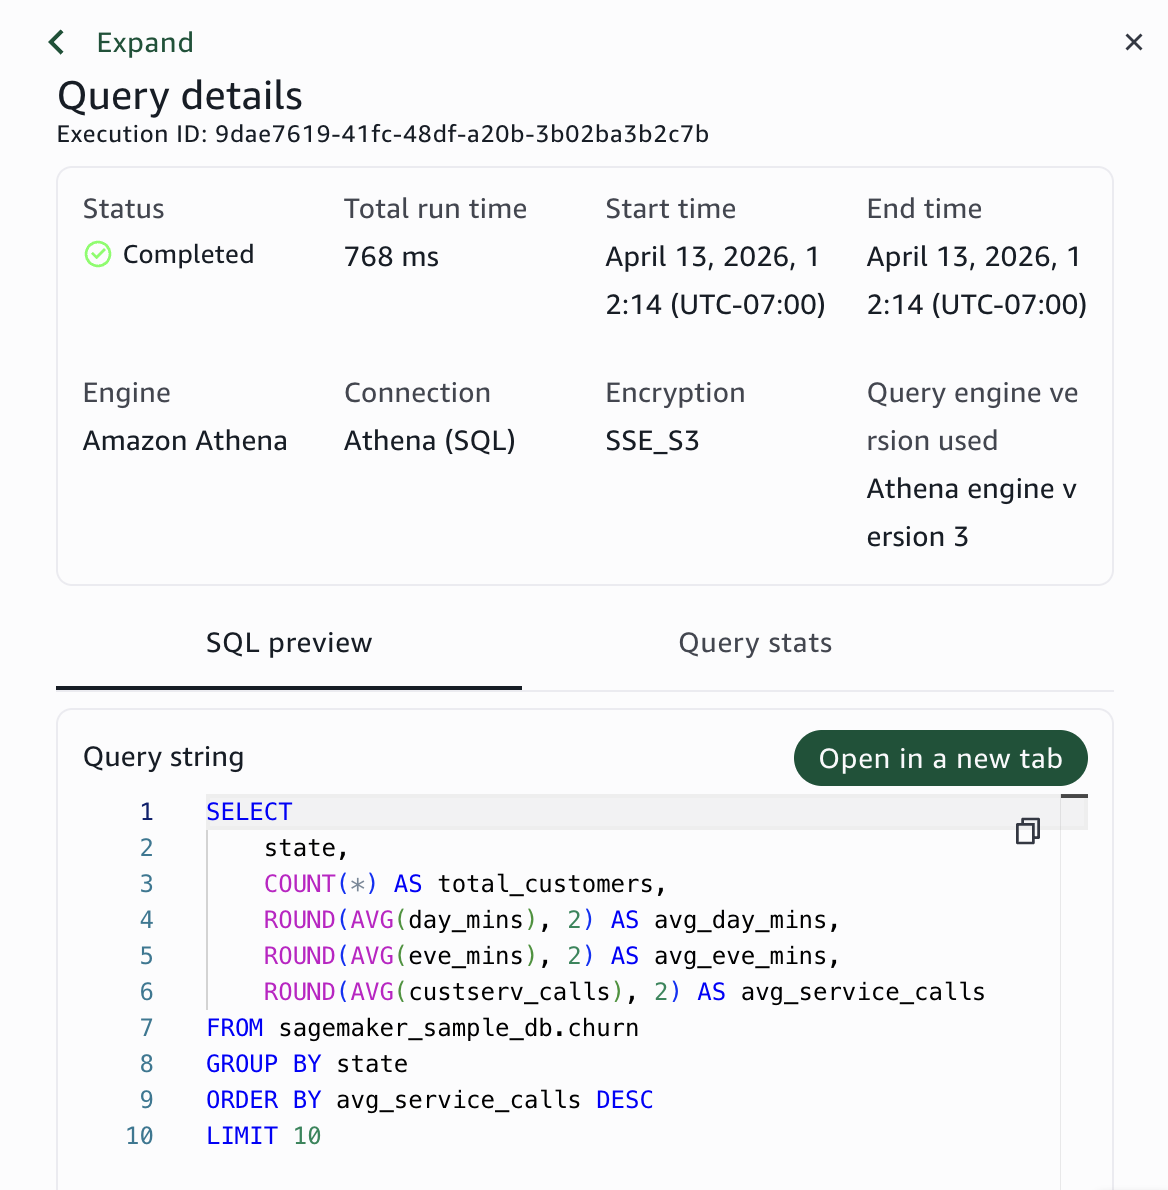
The details shown depend on the query engine:
Amazon Athena queries: Include S3 encryption information and query stats with a visual breakdown of execution time.
Amazon Redshift queries: Include cluster-specific execution details.
To re-open the query in the editor with its full results, choose Open in a new tab.
