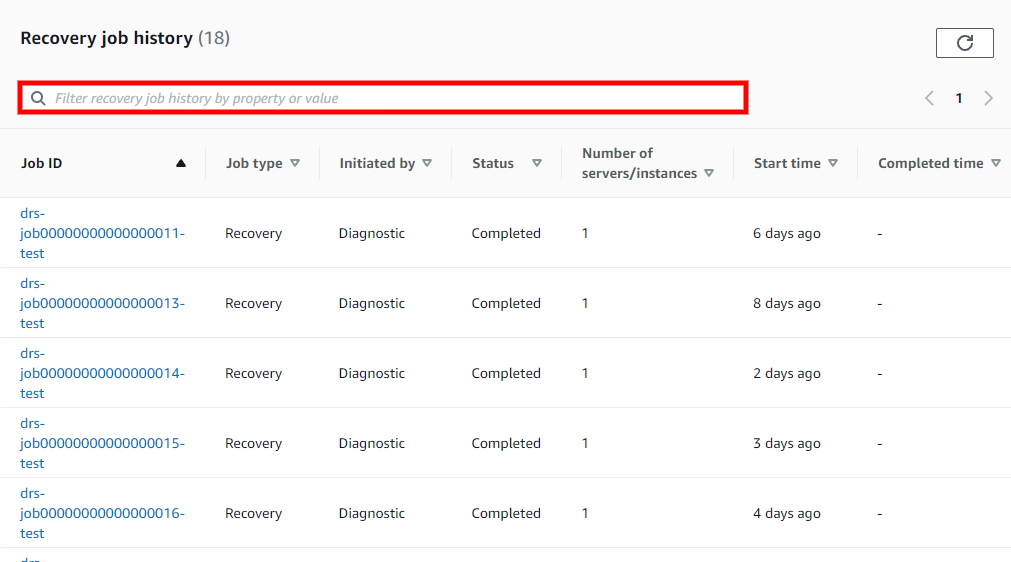
Recovery job history
The Recovery launch history page provides an in-depth overview for operations (Jobs) performed in Elastic Disaster Recovery.
Topics
Recovery job history
The Recovery job history page allows you to track and manage all operations performed in Elastic Disaster Recovery.
You can access the Recovery job history page by choosing Recovery job history on the left-hand navigation menu.

Topics
Overview
The Recovery job history tab shows all of the operations (referred to as "Jobs") performed on your account. Each Job corresponds to a single operation (ex. Launch Recovery instance, Launch Drill instance, etc.) Each Job is composed of one or more servers. The main Recovery job history view allows you to easily identify all key Job parameters, including:

-
Job ID - The unique ID of the Job.
-
Job Type - The type of Job (Recovery, Failback, or Terminate)
-
Initiated By - The command or action that initiated the Job (ex. Drill, Recovery, Failback)
-
Status - The status of the Job (Pending, Completed, or Started)
-
Servers - The number of servers that are included in the Job.
-
Start Time - The time the job was started.
-
Completed Time - The time the Job was completed (blank if the job was not completed)
To sort the Recovery job history by any column (for example, Job ID), click the column header.

You can search for specific Jobs by any of the available fields within the Find launch history by property or value search bar.
Example: Filtered search for the values Job type: Recovery and Status: Completed, only showing completed Recovery Jobs.
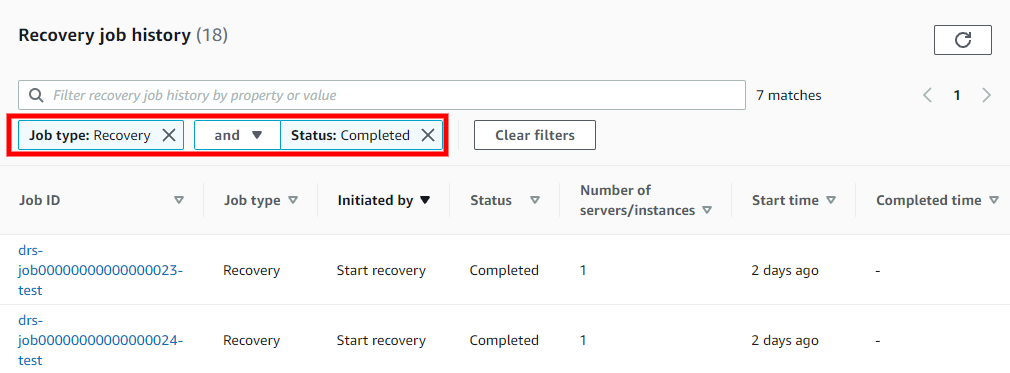
Choose Clear filters to clear the search results and return to the default Job History view.

Job Details
You can view a detailed breakdown of each individual job by choosing the Job ID. Choose the Job ID of any Job to open the Job details view.

The Job details view is composed of three sections:

Details
The Details section shows the same information as the main Job log page, including the Type, Status, Initiated By, Start time, and Completed time.

Job log
The Job log section shows a detailed log of all of the operations performed during the Job.

You can use this section to troubleshoot any potential issues and determine in which step of the launch process they occurred.
You can use the Filter job log by property or value search bar to filter the Job log.

You can filter by a variety of properties, including Time, Event, Source Server Id, Source server hostname, Conversion Server instance Id, Drill/Recovery instance ID, and Error.

You can filter by multiple values at once (for example, Job log filtered by Event: Failed to take snapshot and a specific Source Server Id: 7).

Jobs - Source servers
The Source servers section shows a list of all source servers involved in the Job and their status.
You can use the Filter source servers by property or value search bar to filter by Hostname or Status.

Choose the Hostname of any of Source server from the list to open the Server Details view for that server. Learn more about the Source Server details view.

