Die vorliegende Übersetzung wurde maschinell erstellt. Im Falle eines Konflikts oder eines Widerspruchs zwischen dieser übersetzten Fassung und der englischen Fassung (einschließlich infolge von Verzögerungen bei der Übersetzung) ist die englische Fassung maßgeblich.
Agentendetails — Bewertungen
Evaluationen bietet eine kontinuierliche Qualitätsüberwachung für Ihre KI-Agenten. Sie können die im Dashboard bereitgestellten Informationen verwenden, um die Leistung, Qualität und Zuverlässigkeit Ihrer KI-Agenten zu bewerten.
Anstatt sich auf simulierte Testfälle zu verlassen, erfassen Evaluierungen reale Benutzersitzungen und Agenteninteraktionen und bieten so einen umfassenden Überblick über die Leistung der Agenten, von der Eingabe bis zur endgültigen Ausgabe. Mit Agentenbeurteilungen können Sie Stichprobenregeln definieren, um nur einen Prozentsatz der Sitzungen oder Traces auszuwerten. Anschließend können Sie eine Vielzahl von Evaluatoren einsetzen, um die Betriebsleistung eines KI-Agenten zu bewerten und zu bewerten. Die daraus resultierenden Bewertungen und Ergebnisse werden im Evaluations-Dashboard angezeigt, sodass Sie Trends beobachten, potenzielle Qualitätsprobleme identifizieren, Alarme einrichten und potenzielle Probleme untersuchen und diagnostizieren können.
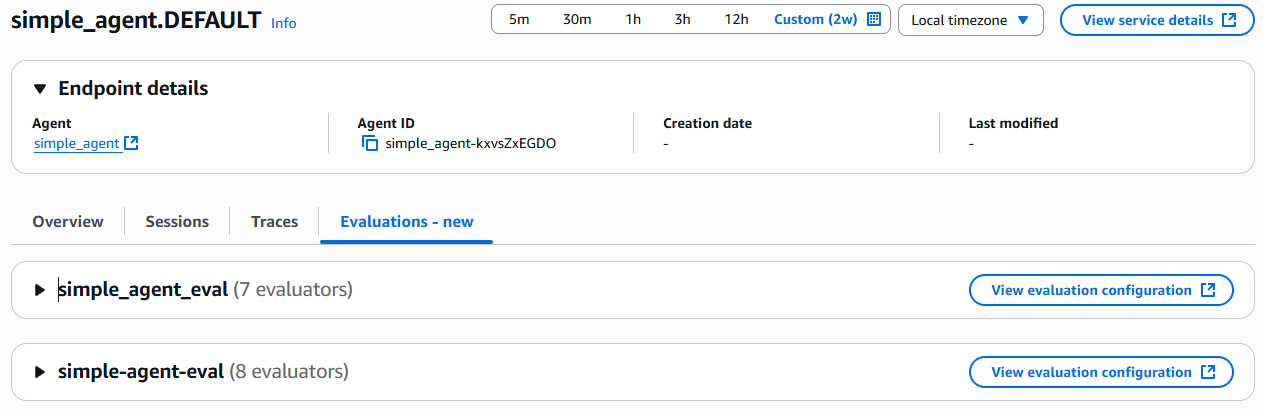
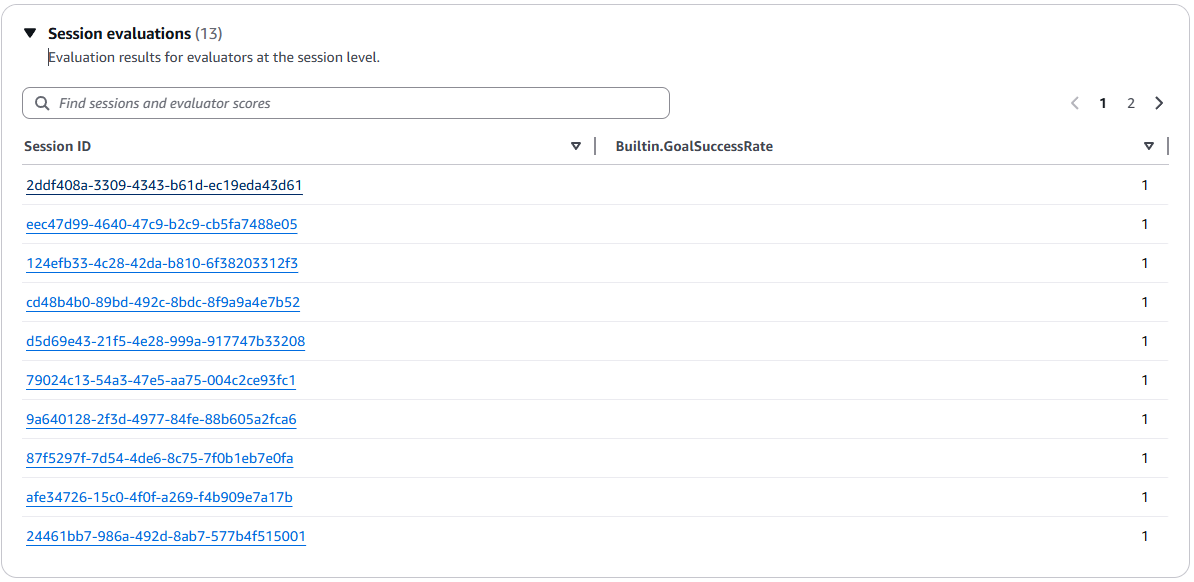
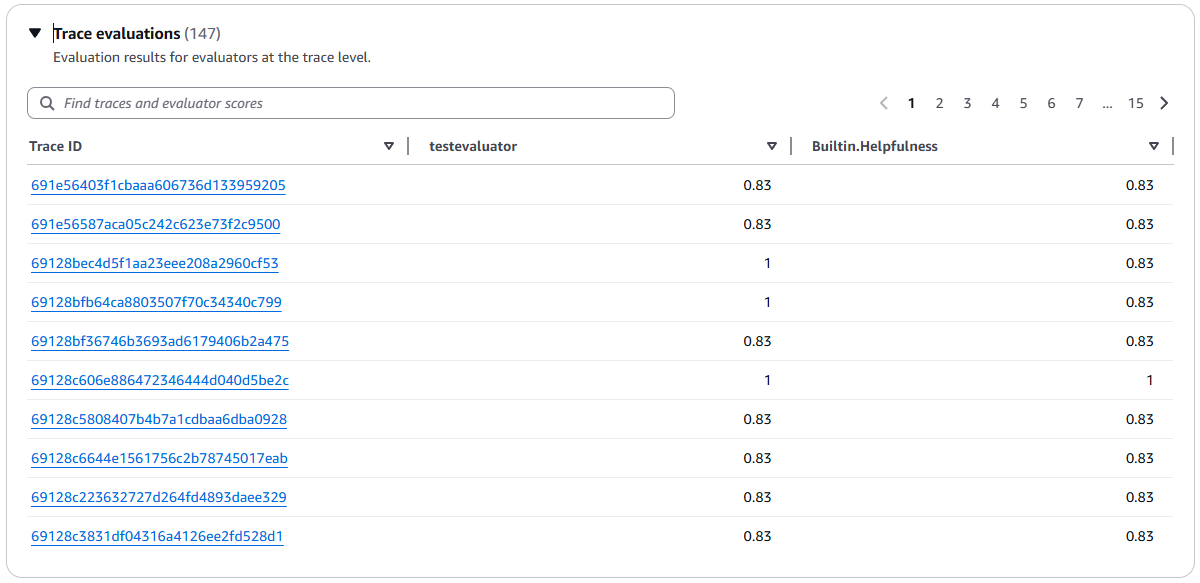
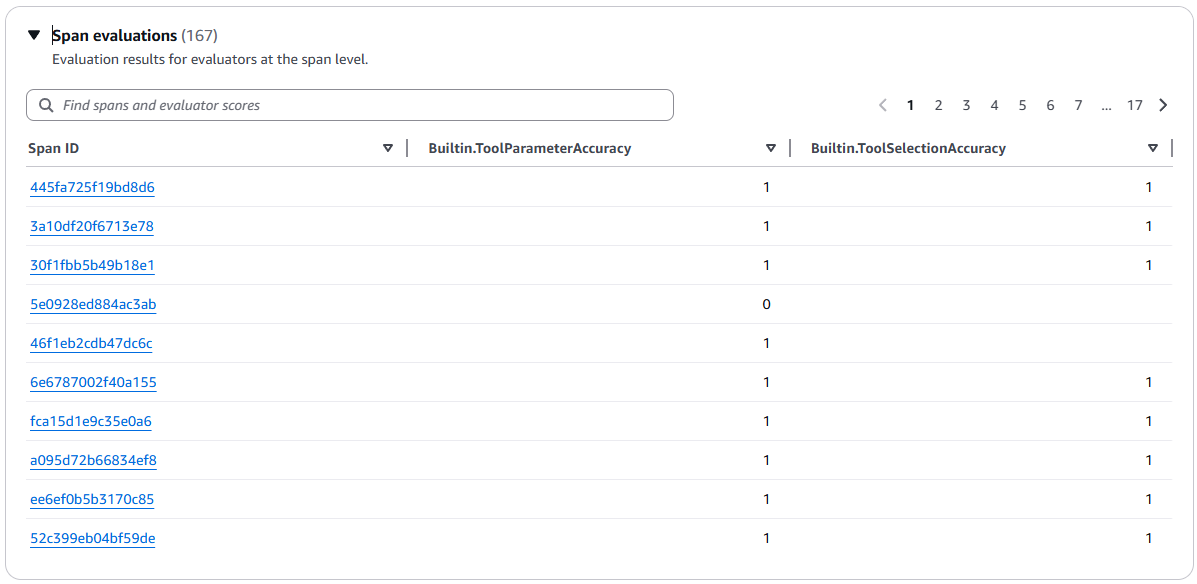
Das Evaluations-Dashboard listet alle Bewertungen auf, die für den ausgewählten Agenten aktiviert und konfiguriert wurden. Weitere Informationen zur Konfiguration von Evaluationen für einen Agenten finden Sie unter AgentCore Evaluationen. Sie können jede Evaluierung erweitern, um die ausgewerteten Sitzungen, Traces und Spans anzuzeigen.
Themen
Einzelheiten zu den Bewertungen
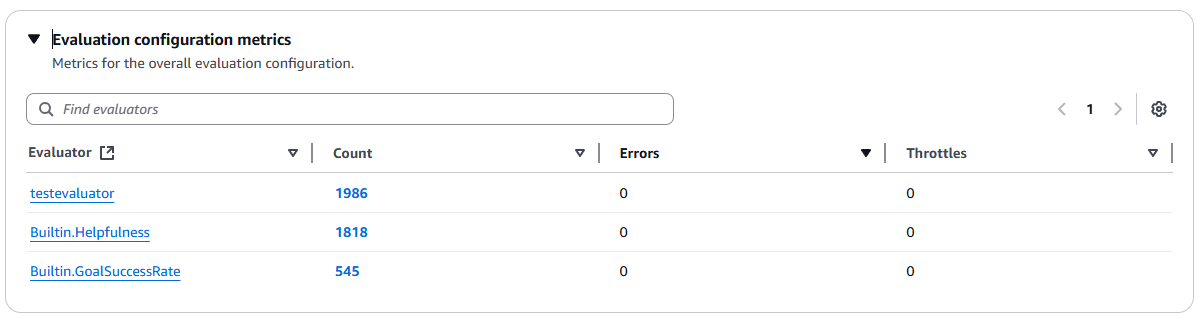
Für jede Bewertung umfasst das Dashboard die folgenden Abschnitte:
Grafiken zu den Bewertungen
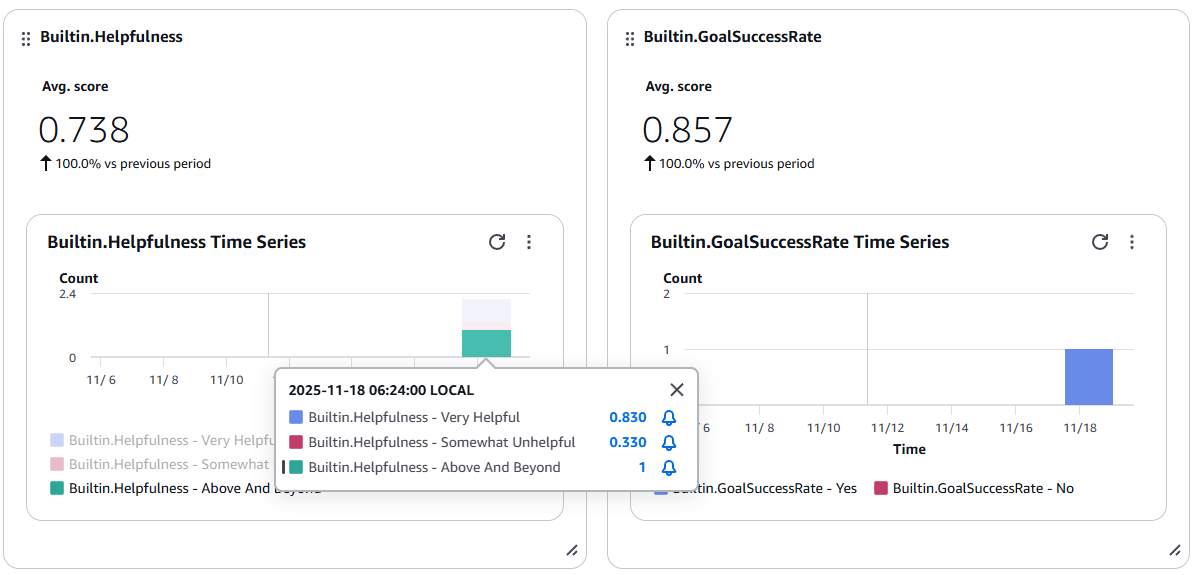
Das Bewertungs-Dashboard enthält auch ein Balkendiagramm für jeden Evaluator. Die Grafiken zeigen die Trends für jeden Evaluator im Zeitverlauf und ermöglichen es Ihnen, Alarme für bestimmte Metrikwerte einzustellen. Um einen Alarm einzustellen, klicken Sie auf einen Balken im Diagramm und wählen Sie dann das Alarmsymbol (Glocke). Weitere Informationen finden Sie unter CloudWatch Amazon-Alarme verwenden.
Arbeiten Sie mit Bewertungsergebnissen
Wenn Sie direkten Zugriff auf Ihre Bewertungsergebnisse benötigen, benutzerdefinierte Visualisierungen erstellen oder außerhalb der AgentCore Evaluationskonsole arbeiten möchten, können Sie über CloudWatch Protokolle, CloudWatch Metriken und CloudWatch Dashboards direkt auf Ihre Bewertungsergebnisse zugreifen.
Themen
Zugriff auf Bewertungsergebnisse in Logs CloudWatch
Ihre Bewertungsergebnisse werden automatisch in CloudWatch Logs in Embedded Metric Format (EMF) veröffentlicht.
Um Ihre Protokollgruppe mit den Evaluationsergebnissen zu finden
-
Öffnen Sie die CloudWatch Konsole.
-
Wählen Sie im Navigationsbereich Logs Management > Log Groups aus.
-
Suchen Sie nach den Protokollgruppen mit dem Präfix: oder navigieren Sie zu diesen
/aws/bedrock-agentcore/evaluations/. -
Innerhalb dieser Protokollgruppe enthalten die Protokollereignisse die Auswertungsergebnisse.
Weitere Informationen zum Arbeiten mit Protokollgruppen und zum Abfragen von Protokolldaten finden Sie unter Arbeiten mit Protokollgruppen und Protokolldatenströmen und Analysieren von Protokolldaten mit CloudWatch Logs Insights.
Zugreifen auf Bewertungsmetriken unter Metriken CloudWatch
Kennzahlen zu den Bewertungsergebnissen werden automatisch aus den EMF-Protokollen (Embedded Metric Format) extrahiert und in CloudWatch Metrics veröffentlicht.
Um Ihre Bewertungskennzahlen zu finden
-
Öffnen Sie die CloudWatch Konsole.
-
Wählen Sie im Navigationsbereich Metriken > Alle Metriken aus.
-
Wählen Sie den AgentCore/EvaluationsBedrock-Namespace aus.
-
Durchsuchen Sie die verfügbaren Metriken nach Dimensionen.
Weitere Informationen zum Anzeigen und Arbeiten mit Metriken finden Sie unter Metriken verwenden und CloudWatch Metriken grafisch darstellen.
Benutzerdefinierte Dashboards erstellen
Sie können benutzerdefinierte Dashboards erstellen, um Ihre Bewertungskennzahlen zusammen mit anderen betrieblichen Kennzahlen zu visualisieren.
Um ein Dashboard mit Bewertungskennzahlen zu erstellen
-
Wählen Sie in der CloudWatch Konsole im Navigationsbereich Dashboards aus.
-
Klicken Sie auf Dashboard erstellen.
-
Fügen Sie Widgets hinzu und wählen Sie Metriken aus dem AgentCore/EvaluationsBedrock-Namespace aus.
-
Passen Sie den Zeitraum, die Statistik und den Visualisierungstyp an Ihre Bedürfnisse an.
Ausführliche Anweisungen finden Sie unter Erstellen von und Arbeiten mit benutzerdefinierten Dashboards und Verwenden von CloudWatch Dashboards.
Alarme für Bewertungsmetriken einrichten
Sie können Alarme einrichten, sodass Sie benachrichtigt werden, wenn Bewertungskennzahlen bestimmte, von Ihnen festgelegte Schwellenwerte überschreiten, z. B. wenn die Richtigkeit unter ein akzeptables Niveau fällt.
Um bei Bewertungskennzahlen einen Alarm auszulösen
-
Wählen Sie in der CloudWatch Konsole Alarme > Alle Alarme aus.
-
Wählen Sie Alarm erstellen aus.
-
Wählen Sie Metrik auswählen und navigieren Sie zum AgentCore/EvaluationsBedrock-Namespace.
-
Wählen Sie die Metrik aus, die Sie überwachen möchten.
-
Konfigurieren Sie die Schwellenbedingungen (der Schwellenwert für die dynamische Erkennung von Anomalien ist verfügbar, wenn Sie keinen statischen Schwellenwert angeben müssen) und die Benachrichtigungsaktionen.
Ausführliche Anweisungen finden Sie unter Verwenden von CloudWatch Alarmen und Erstellen eines CloudWatch Alarms auf der Grundlage eines statischen Schwellenwerts.
Weitere Ressourcen
