Die vorliegende Übersetzung wurde maschinell erstellt. Im Falle eines Konflikts oder eines Widerspruchs zwischen dieser übersetzten Fassung und der englischen Fassung (einschließlich infolge von Verzögerungen bei der Übersetzung) ist die englische Fassung maßgeblich.
Arbeitsspeicher
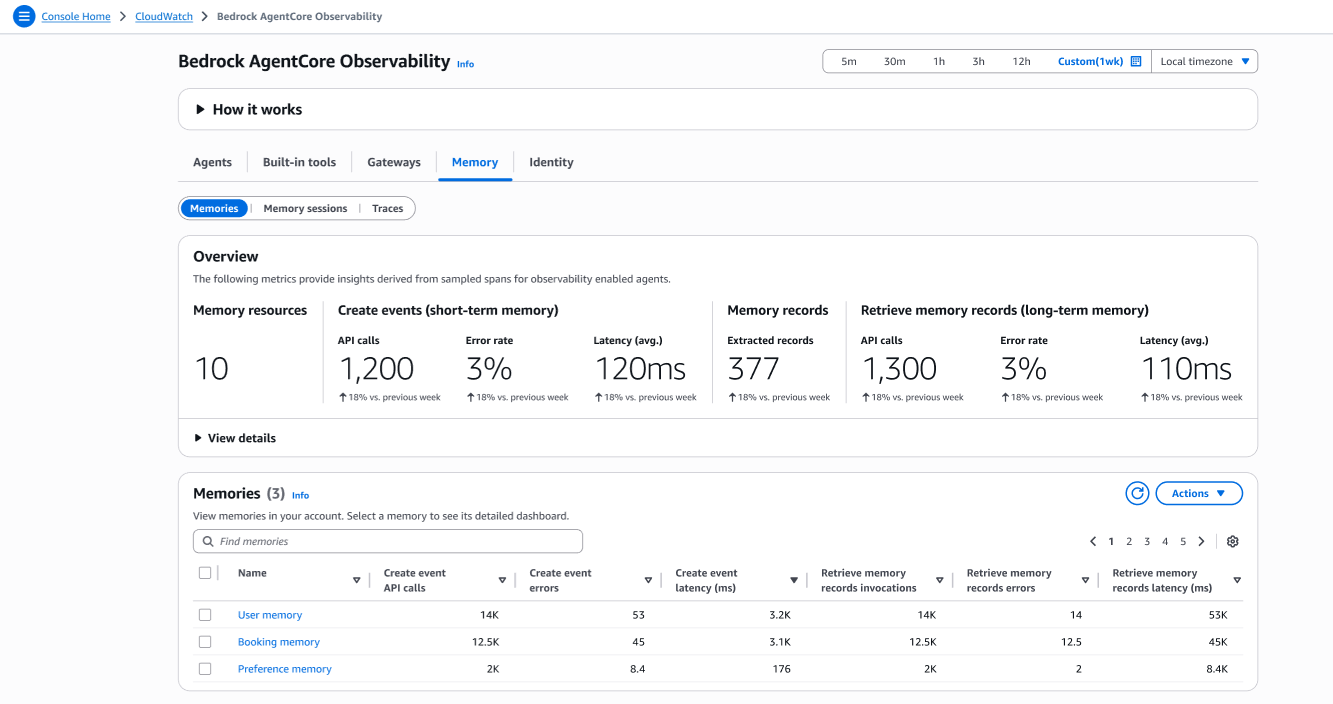
Erfahren Sie, wie Ihre Agenten Kontextinformationen speichern, abrufen und verwenden, um personalisierte Erlebnisse bereitzustellen. Weitere Informationen zu Amazon Bedrock AgentCore Memory finden Sie unter Speicher zu Ihrem AI-Agenten hinzufügen. Die Speicherbeobachtbarkeit umfasst drei wichtige Überwachungsbereiche:
Speicher — Überwachen Sie die Speicher- und Abrufmuster
Speichersitzungen — Überwachen Sie die Speichernutzung innerhalb einzelner Sitzungen
Ansicht „Ablaufverfolgungen“ — Greifen Sie auf detaillierte Ablaufverfolgungsinformationen für Speicheroperationen zu
Informationen zum Kurzzeit- oder Langzeitgedächtnis finden Sie unter Speicher zu Ihrem KI-Agenten hinzufügen.
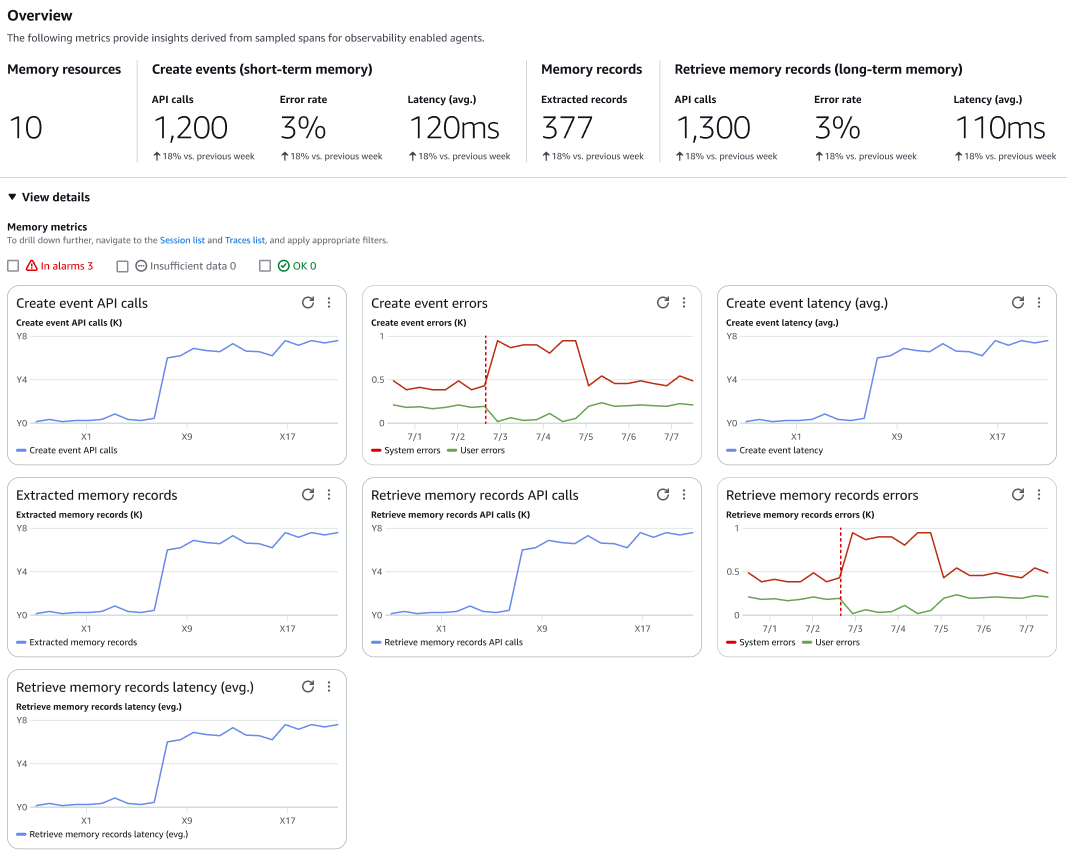
Wählen Sie Details anzeigen, um die Speichermetriken in Diagrammen anzuzeigen.
Unter Erinnerungen können Sie alle mit Ihrem Konto verknüpften Erinnerungen einsehen. Wählen Sie einen Speichernamen, um die Speicherdetails anzuzeigen.
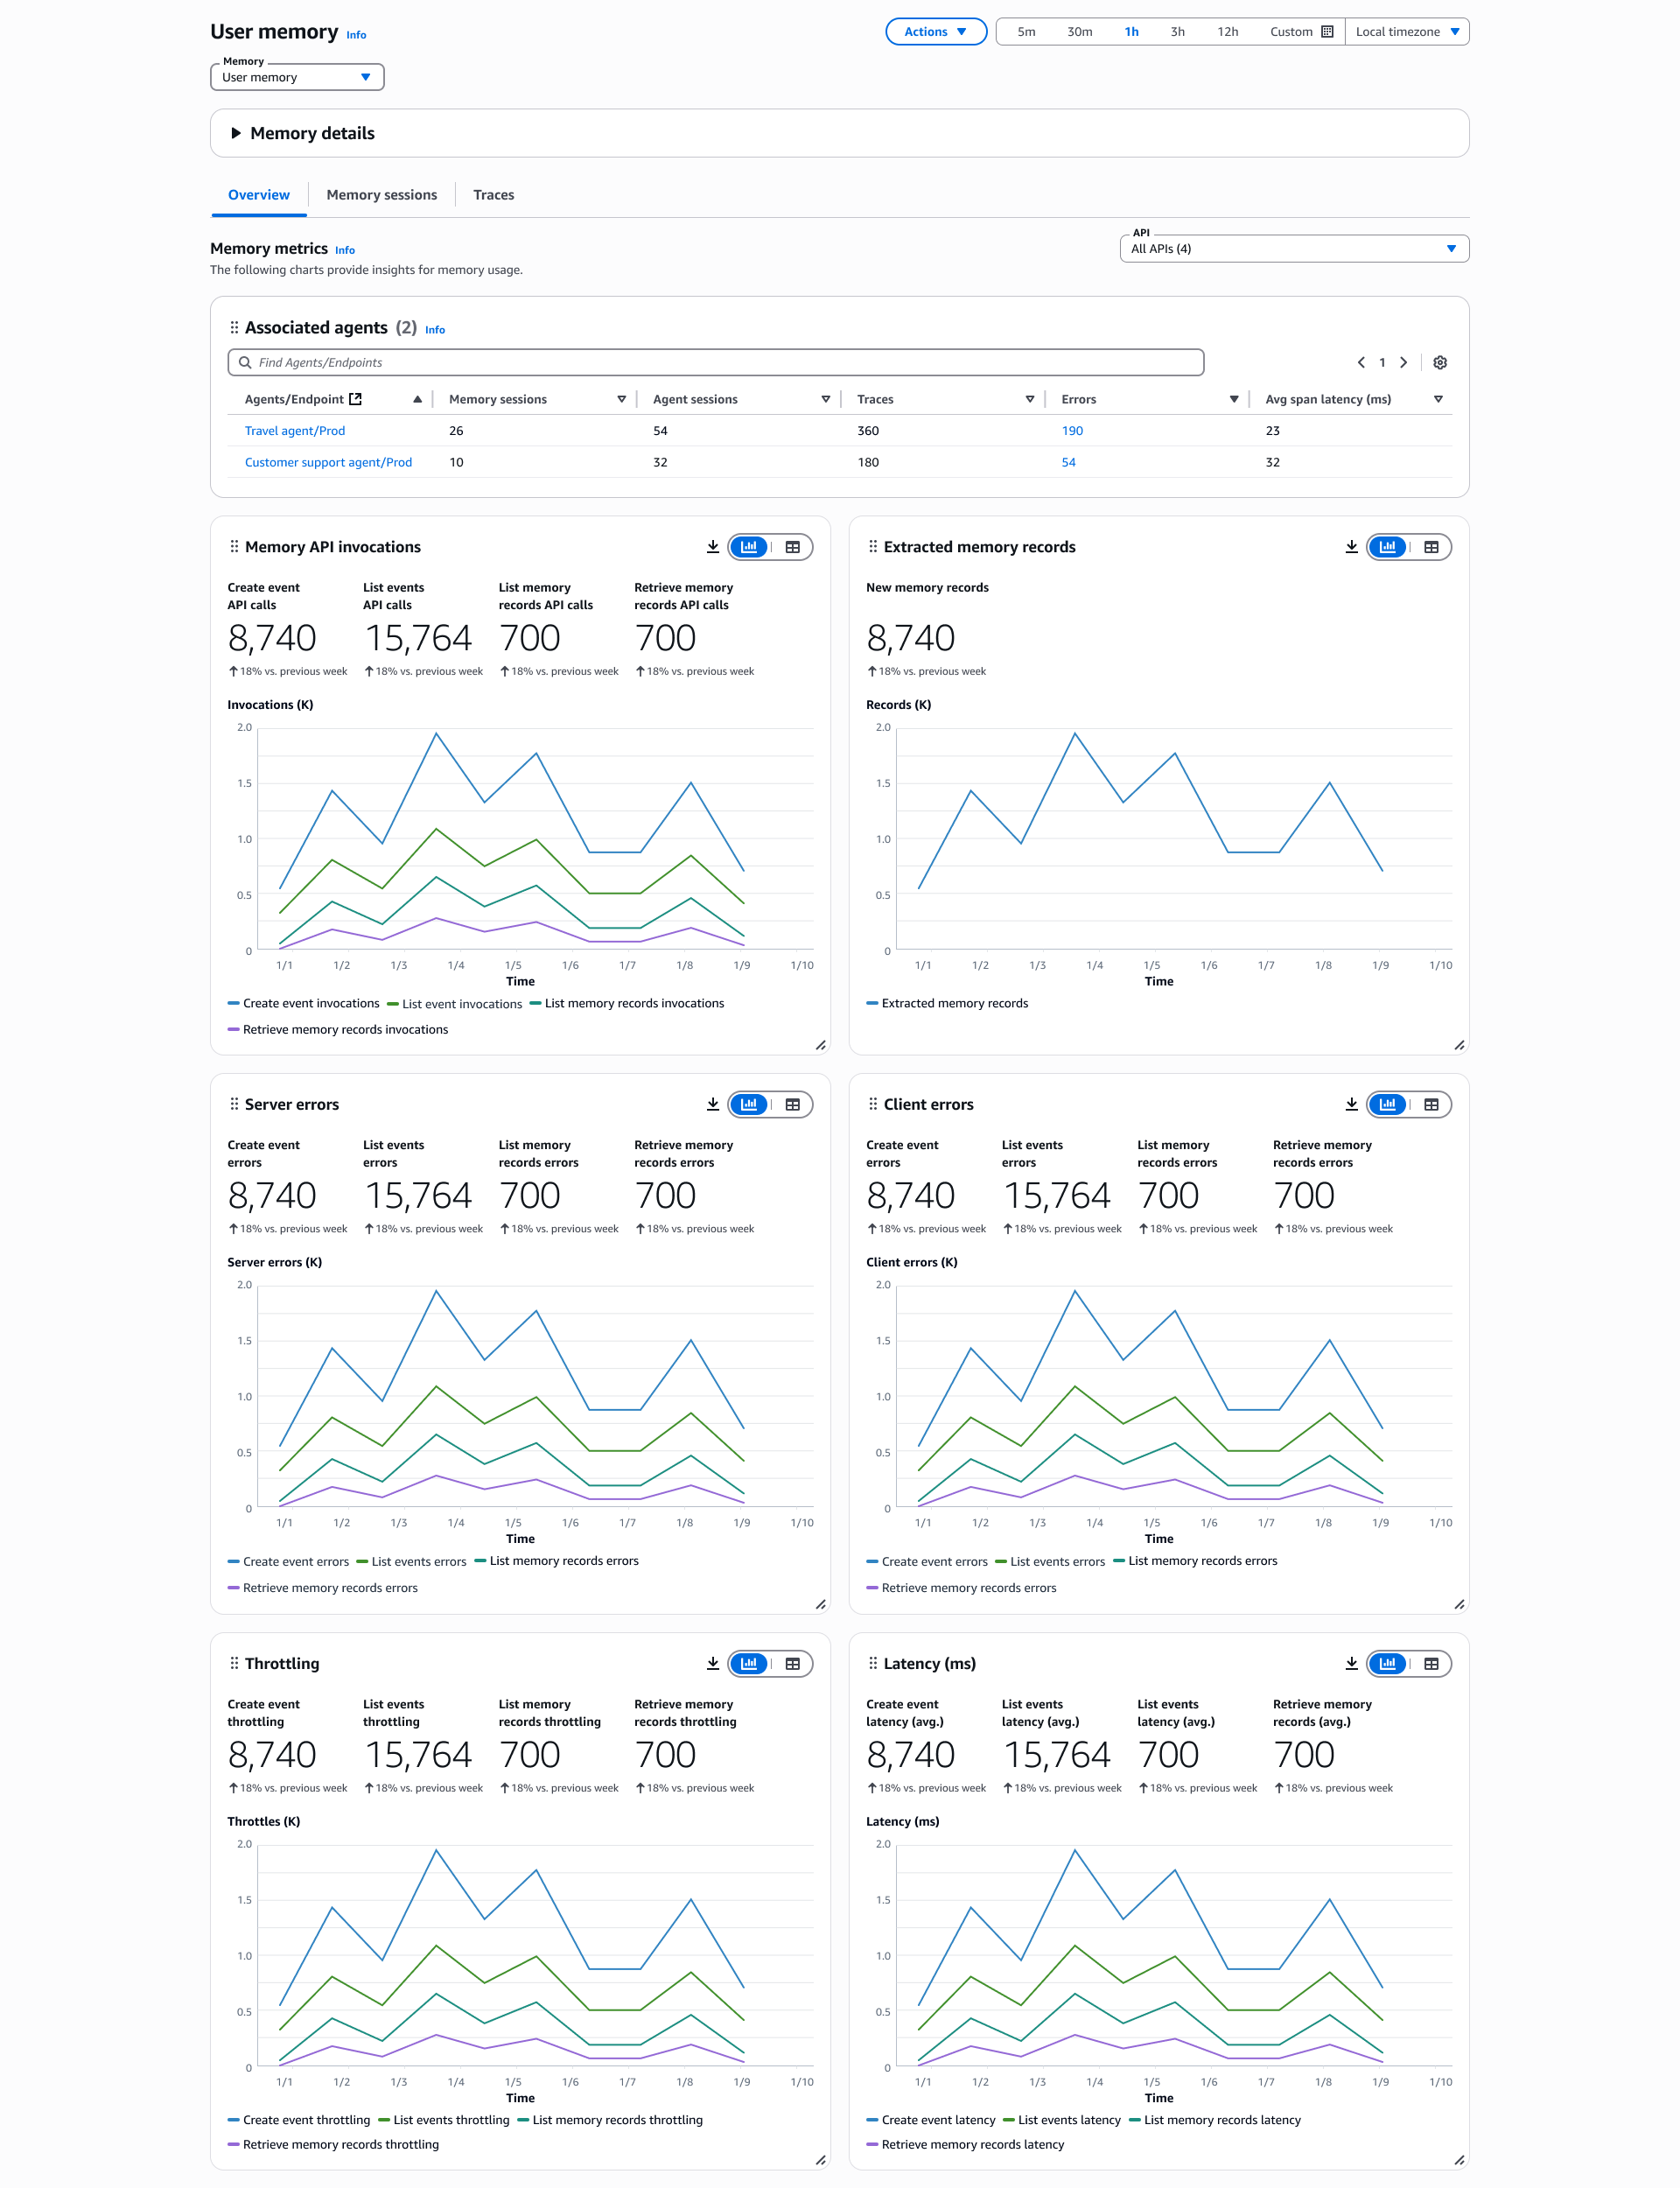
Auf der Seite mit den Speicherdetails werden die folgenden Registerkarten angezeigt:
Überblick — Zeigt umfassende Kennzahlen zur Speicherleistung und Nutzungsmuster für die ausgewählte Speicherressource an
Zugeordnete Agenten — Sie können die Agenten anzeigen, die den Speicher verwenden. Wählen Sie eine Agent/Endpoint, um die Agenten-Übersichtsseite anzuzeigen.
Speicher-API-Aufrufe — Gesamtzahl der API-Aufrufe für Speichervorgänge, einschließlich Speicher-, Abruf- und Aktualisierungsanforderungen. Diese Metrik hilft bei der Nachverfolgung der Speichersystemnutzung und der Kapazitätsplanung
Extrahierte Speicherdatensätze — Anzahl der Speicherdatensätze, die erfolgreich aus Agenteninteraktionen extrahiert und verarbeitet wurden. Dazu gehören Kontextinformationen, Benutzereinstellungen und der Konversationsverlauf, den Agenten zur Personalisierung speichern
Serverfehler — Anzahl der Systemfehler bei Speicheroperationen. Hohe Werte deuten auf potenzielle Infrastrukturprobleme mit Speicher-, Speicher- oder Abrufsystemen hin, die untersucht werden müssen
Client-Fehler — Fehler, die auf ungültige Speicheranforderungen, falsch formatierte Daten oder Zugriffsrechte zurückzuführen sind. Hohe Client-Fehlerraten können auf Probleme mit der Speicherintegration oder der Datenformatierung des Agenten hinweisen
Drosselung — Anzahl der Speicheranforderungen, die aufgrund der Überschreitung der zulässigen Transaktionslimits gedrosselt wurden. Überwachen Sie diese Metrik, um festzustellen, ob die Speicherzugriffsmuster optimiert werden müssen oder ob die Servicekontingenten angepasst werden müssen
Latenz — Reaktionszeit für Speichervorgänge, einschließlich Speicher- und Abrufanforderungen. Verfolgen Sie die Latenzen von P50, P90 und P99, um Leistungsengpässe zu identifizieren und Speicherzugriffsmuster zu optimieren
Speichersitzungen — Sie können die Sitzung, die Kurzzeitgedächtnis enthält, anhand von Interaktionen mit Agenten anzeigen. Wählen Sie unter Speichersitzungen die Option Sitzungs-ID aus, um das Sitzungs-Dashboard aufzurufen.
Traces — Zeigt die Traces für Agenten an. Wählen Sie unter Traces die Option Trace ID aus, um die Traces anzuzeigen, die einen bestimmten Speicher aufrufen. Sie können das Traces-Dashboard verwenden, um sich eingehend mit der Speichernutzung der Agenten und den endgültigen Antworten zu befassen.
Anmerkung
Die Benutzeroberfläche und die Felder der Registerkarten „Speichersitzungen“ und „Traces“ sind in Built-in Bezug auf Tools, Gateways, Speicher und Identity Observability ähnlich. Weitere Informationen zu den Feldern finden Sie unter. Tool zum Code-Interpreter
