Streaming modes on Windows, Linux, and macOS clients
The steps depend on the client used.
- Windows
-
-
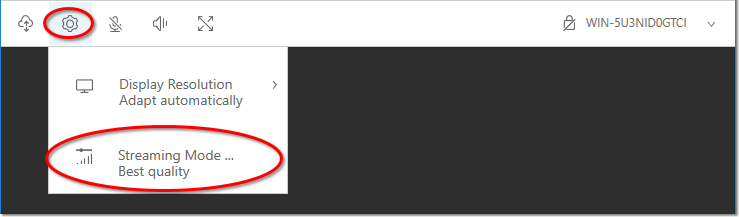
Choose the Settings icon.
Select Streaming Mode from the drop-down list.
-
In the Streaming Mode window, choose one of the following options:
Best responsiveness
Best quality
Close the Streaming Mode window.
Tip
For information about network performance, choose Display Streaming Metrics. For more information, see Streaming metrics.
-
- macOS
-
-
In the menu bar, choose the Connection menu, then select Display.
-
Under Optimize Streaming For, choose one of the following options:
Responsiveness
Image Quality

Tip
For information about network performance, choose the Dashboard toolbar button. For more information, see Streaming metrics.
-
- Linux
-
-
Click on the Display Settings menu icon from the toolbar at the top.
In the Streaming mode section, choose one of the following options:
Best responsiveness
Best image quality

-
Streaming metrics
The streaming metrics can be used to evaluate your network performance and determine which streaming mode is suitable for your network conditions.
Note
Metrics are displayed for the current Amazon DCV session connection.
To view the streaming metrics, do one of the following depending on the client used.
- Windows
-
Choose Settings, Streaming Mode, Display Streaming Metrics.
The streaming metrics provide the following real-time information:
Framerate – Indicates the number of frames received from the Amazon DCV server every second.
Network latency – Indicates the amount of time (in milliseconds) it takes for a packet of data to be sent to the Amazon DCV server and back to the client.
Bandwidth usage – Indicates the amount of data being sent and received over the network connection. The red line shows the peak network throughput. The yellow line shows the average throughput. The blue line shows the current (real-time) throughput.

- macOS
-
Choose the Dashboard toolbar button and select the Metrics tab.
Tip
You can also open the Dashboard from the menu bar. Choose the View menu, then select Dashboard….
The Metrics tab provides the following information:
Connection status – Healthy, Unstable, or Offline indicator.
Time to first frame – How long it took to display the remote desktop after connecting.
Bandwidth usage – Network usage over time.
Framerate – Frames per second received from the Amazon DCV server.
Network latency – Response time in milliseconds.
Each chart shows current, average, and peak values. Hover over the charts to see precise values at any point in time.
The Dashboard can be pinned as a sidebar or detached as a floating window. Choose Copy to copy metrics info to the clipboard.

Tip
You can also display the streaming metrics directly in the toolbar by choosing the View menu, then selecting Metrics in Toolbar.

- Linux
-
Click on the Streaming Metrics icon (the information icon) in the toolbar at the top, and then select the Streaming Metrics tab.
You can also configure the client to display the streaming metrics directly in the toolbar by turning on the Streaming metrics in the toolbar option.
The streaming metrics provide the following real-time information:
Framerate – Indicates the number of frames received from the Amazon DCV server every second.
Network latency – Indicates the amount of time (in milliseconds) it takes for a packet of data to be sent to the Amazon DCV server and back to the client.
Bandwidth usage – Indicates the amount of data being sent and received over the network connection. The red line shows the peak network throughput. The yellow line shows the average throughput. The blue line shows the current (real-time) throughput.

