[New] Custom Metrics
Overview
If your Connect instance is enabled Ultimate AI, you can create and manage custom metrics with advanced filters and functions on metric primitives and have them available for your dashboards.
Contents
Manage your custom metrics
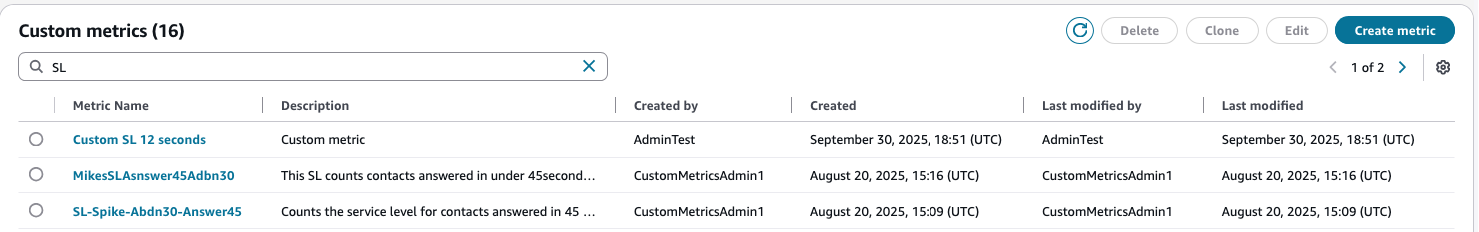
In the Dashboards and reports, you will find "Custom metrics" under Dashboards tab that list all the custom metrics in your instance. Custom service level metrics that were created via the custom dashboards will be listed and can be managed here as well.
You can do character matching quick search on the metric name or description by entering on the search text box.
You can select a metric to edit, delete or clone. Choosing on the metric name in the listing page leads you to the full view of the custom metric.
Create, Edit custom metric
To create a custom or edit a metric, navigate to Dashboards and reports page “Custom metrics” section. Choose on the “Create metric” button to create a metric or select an existing metric and choose on “Edit” button.
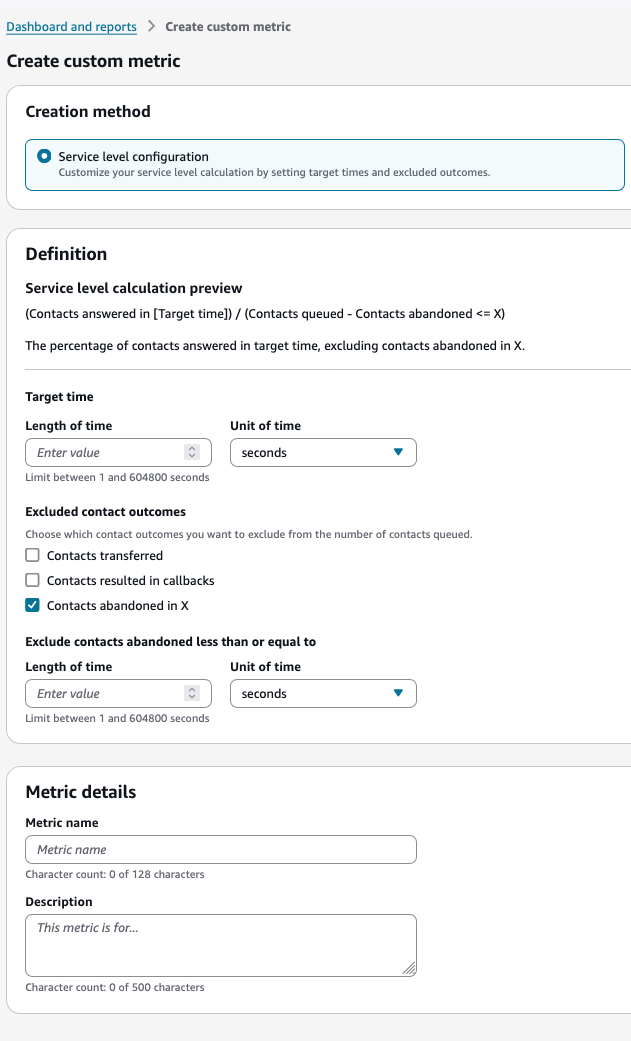
When creating a custom metric, you need to choose if the metric is for Service level configuration or and advanced metric using metric builder.
-
Service level configuration - Set exclusion criteria and define answer time, abandon time thresholds for service level calculations
-
Metric builder - Create advanced custom metrics with metric primitives using mathematical operations and functions. Please see custom metric primitives for more information.
Service Level Configuration
-
Metric name:- Enter a unique name (maximum 128 characters)
-
Description (optional): Provide details about the metric's purpose (maximum 500 characters)
-
Target time: Specify the service level threshold.
-
Length: Enter a value between 1 second and 7 days
-
Unit: Select seconds, minutes, hours, or days
-
-
Excluded contact outcomes: Choose which types of contacts to exclude from the denominator:
-
Contacts transferred
-
Contacts resulted in callbacks
-
Contacts abandoned in X seconds/minutes/hours/days
-
-
The service level calculation preview updates automatically as you configure these settings. The preview shows:
-
The calculation formula.
-
A plain language explanation of what the metric measures.
-
The percentage of contacts answered within your target time, excluding any contact types you specified.
-
Metrics Builder
The metrics builder is an interactive editor that allows you to define an advanced custom metric with metric primitives and mathematical operators. For the full list of primitives and operators, and examples of advanced custom metrics, please see link
Steps to create a custom metrics with Metric Builder:
-
Choose on the “Create Metric” button on the main dashboard page.
-
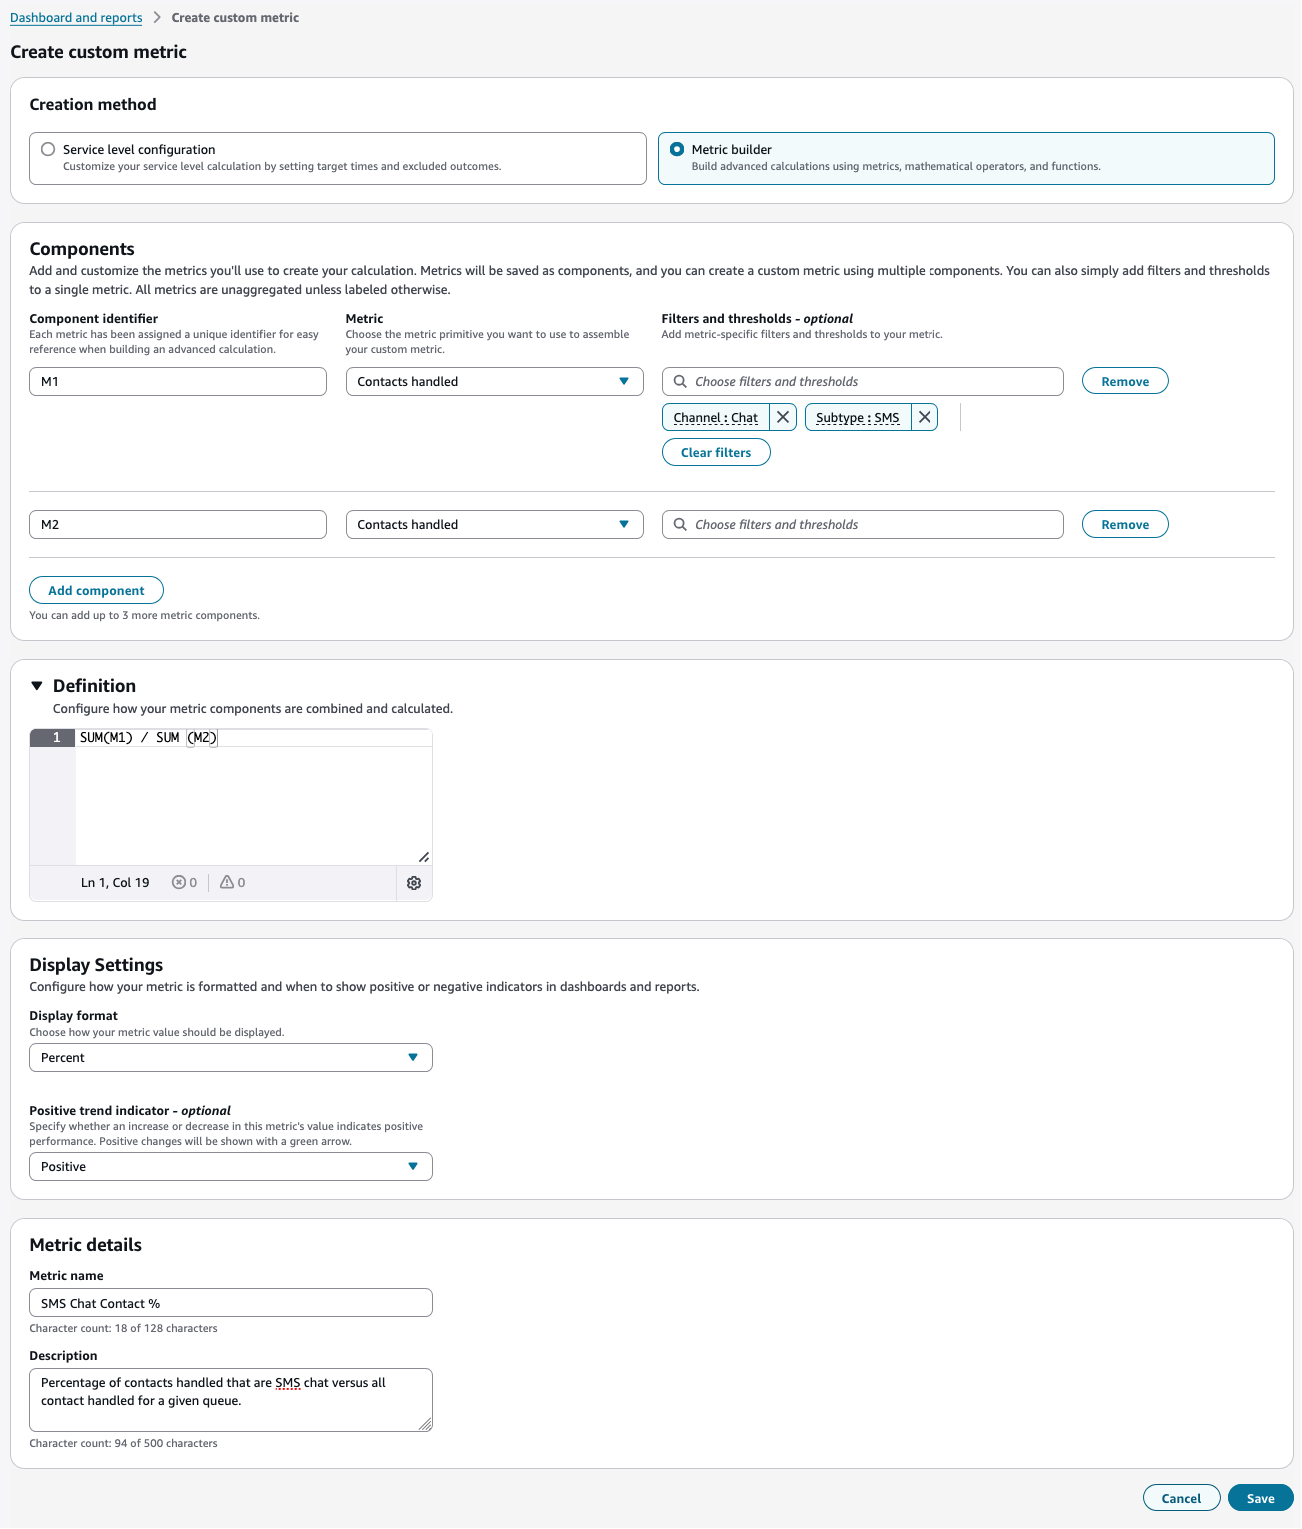
In the “Create Custom Metric” page, select the “Metric Builder” option.
-
Start by defining the components for a custom metric.
-
For example, we want to create a rate metric that calculates the percentage of total contacts handled that are SMS that is a channel subtype of Chat.
-
Specify “M1” or any variable name for “contacts handled”, then add optional filters: channel = “Chat” and subtype = “SMS”.
-
Next specify “M2” for another metric primitive. For example, “contacts handled” with no filters.
-
-
In the definition, specify “100 * SUM(M1) / SUM(M2)” which will be a rate metric that defines sum of all contacts handled for chat SMS channel versus all contacts handled.
-
Select display format as “Percent”.
-
Select appropriate value for optional field positive trend indicator.
-
Specify a unique name for your metric.
-
Add appropriate description for your metric.
-
Check if there are any errors in the form, the "Save" button will automatically become enabled at the bottom of the page once there are no errors.
-
Choose “Save” at the bottom of the page to create your custom metric.
-
When this custom metric is added to a widget, appropriate grouping will apply to the metric.
Components
A component represents the metric primitive or base metric expression that can be referenced as the variable for the metric formula that will be entered via the definition editor.
-
Maximum of 5 metric components can be added.
-
Component identifier
-
Starts with underscore or letter followed by letters, numbers or underscores only.
-
Should be unique across the added components.
-
-
Metric
-
Metric primitive to attach with the respective component.
-
Refer link to see what metric primitives can be used together among different components
-
-
Filters and thresholds
-
Applies filters and thresholds to a selected metric.
-
Existing filters and thresholds will be removed upon selecting a new metric.
-
Can apply up to 5 filters for any selected metric.
-
Can select up to 10 values for a particular filter.
-
Refer link for supported filter values.
-
Optional
-
Note
A custom metric using a metric primitive of Current Contact category can only support at most 1 component.
Definition:
Define an expression using component identifiers, available mathematical operators and functions. The expression will be evaluated to calculate a custom metric value.
-
Refer link for supported mathematical operators, functions and sample expressions.
-
The definition section requires users to add at least one component.
-
Up to 1024 characters are allowed in the expression.
Note
This section is disabled and cannot be used when a Current Contact metric primitive is used to build a custom metric.
Example
Display format:
Specifies the display format for calculated custom metric value on dashboards.
-
Percent - “%” added to the end of the calculated custom metric value display
-
Integer - integer value on the calculated custom metric. If the calculated metric is “3.141592”, the value will be “3.00”
-
Double - decimal value on the calculated custom metric. If the calculated metric is “3.141592”, the displayed value will be “3.142” after rounding up to 3 decimal places.
-
Seconds - “HH:MM:SS” formatted value on the calculated custom metric.
Positive trend indicator:
Specifies whether an increase or decrease in this metric's value indicates positive performance when the custom metric is added to any Summary widget-
Positive - changes will be shown with a green arrow
-
Negative - changes will be shown with a red arrow
-
Neutral - changes will be shown without any indicators.
-
Optional
Metric name:
Name of the custom metric-
Up to 128 characters
-
Should be unique
Description:
Description of the custom metric-
Up to 500 characters
-
Optional
Typical callouts when using the editor
-
To access metric builder your Connect instance should have Ultimate AI enabled.
-
Metrics created using metric builder will not be accessible for editing once Ultimate AI is disabled.
View Custom metric
To view a custom metric, navigate to Dashboards and reports, and choose on the name of a custom metric in the "Custom metrics" section under Dashboards tab that list all the custom metrics in your instance. When you view a custom metric, you'll see the following information:
Custom metric details:
-
Metric name: The name you assigned to the custom metric
-
Status: Shows whether the metric is "Published" and available for use
-
Description: A brief explanation of the metric's purpose
-
Creation method: Shows how the metric was created (Service level or Metric builder)
-
Created: Date, time, and user who created the metric
-
Modified: Date, time, and user who last modified the metric
-
ARN: The Amazon Resource Name unique identifier for the metric, this can be used to query the GMDv2 api.
Components:
-
Component identifier: The reference ID for each component (e.g., M1, M2)
-
Metric: The base metrics used in the calculation (e.g., Contacts handled, Contacts queued)
-
Filters and thresholds: Any conditions applied to the metrics (e.g., Queue time (ms) <= 12000)
-
Definition: The mathematical formula used to calculate the custom metric (e.g., 100 * SUM(M1) / SUM(M2))
Display Settings:
-
Display format: How the metric value is presented (e.g., Percent)
-
Positive trend indicator: How positive trends are indicated (e.g., Neutral)
You can also manage your custom metric using the action buttons at the top of the page:
-
Delete: Remove the custom metric
-
Clone: Create a copy of the custom metric
-
Edit: Modify the custom metric's configuration
Clone Custom metric
Cloning a custom metric, allows you to copy over an existing custom metric calculation, make any changes and save as a new custom metric. Clone can be performed on the Dashboards and reports, by selecting a custom metric in the "Custom metrics" section under Dashboards tab that list all the custom metrics in your instance and choosing on the clone button. It can also be performed by navigating to the custom metrics view page and choosing on the clone button.
Delete Custom metric
Custom metrics can be deleted from either the custom metrics list or the metric view page. When you delete a custom metric, the system requires confirmation to prevent accidental deletions.
To delete a custom metric:
-
Navigate to Dashboards and reports, and locate the custom metric you want to delete in the "Custom metrics" section under the Dashboards tab.
-
Choose the Delete button for the metric you wish to remove (or open the metric and choose Delete from the view page).
-
A confirmation dialog will appear requiring you to type "confirm" to prevent accidental deletions.
-
Choose Delete to permanently remove the metric, or Cancel to abort the deletion process.
Important
Important considerations:
-
This action is permanent and cannot be undone. Once deleted, the metric and all its associated data will be removed from your instance.
-
Impact on dashboards: If the deleted metric was used in any dashboards, those widgets will display an error message indicating that the metric is no longer available.
Add custom metric to dashboard widget
Custom metrics that you create can be added to dashboard widgets to visualize and monitor your data. You can add custom metrics through the widget edit menu, from any dashboard widget, select the Actions icon and then choose Edit.
To add a custom metric to a dashboard widget:
-
From any dashboard widget, select the Actions icon and then choose Edit.
-
In the edit panel, you'll see a list of available metrics organized into categories:
-
Standard metrics (such as Proactive intent engagement rate, Reference count, and Response completion rate)
-
Custom metrics section showing the list of available custom metrics in your instance.
-
To add a custom metric:
-
Use the search field at the top to find a specific metric by name
-
Scroll through the Custom metrics section to browse available options
-
Choose on the custom metric you want to add from the list
-
-
-
Choose Add metric to include your selection in the widget.
Note
Widgets have a limit on the number of metrics that can be added. The interface will display how many more metrics you can add (e.g., "You can add up to 1 more").
-
Choose Save to apply your changes to the widget, or Cancel to discard your changes.
