Amazon Monitron is no longer open to new customers. Existing customers can continue to use the service as normal. For capabilities similar to Amazon Monitron, see our [blog post](https://aws.amazon.com/blogs/machine-learning/maintain-access-and-consider-alternatives-for-amazon-monitron).
# Step 2: Viewing asset conditions
Viewing assets is more than simply understanding the icons that show the asset and position health status. It is often useful to see the data collected by the sensors yourself.
**To view sensor data in the Amazon Monitron mobile app**
1. In the **Assets** list, choose the asset you want to view.
1. Choose the position with the data that you want to view.
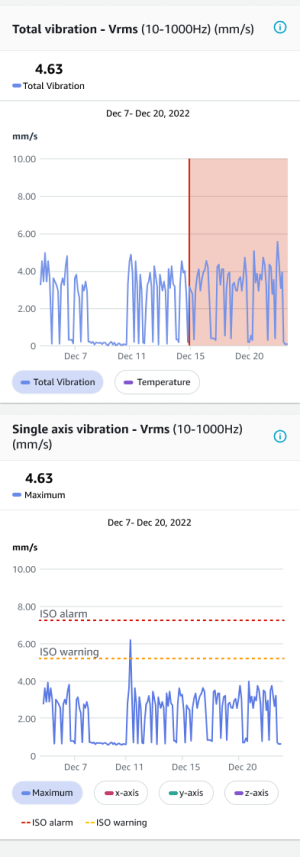
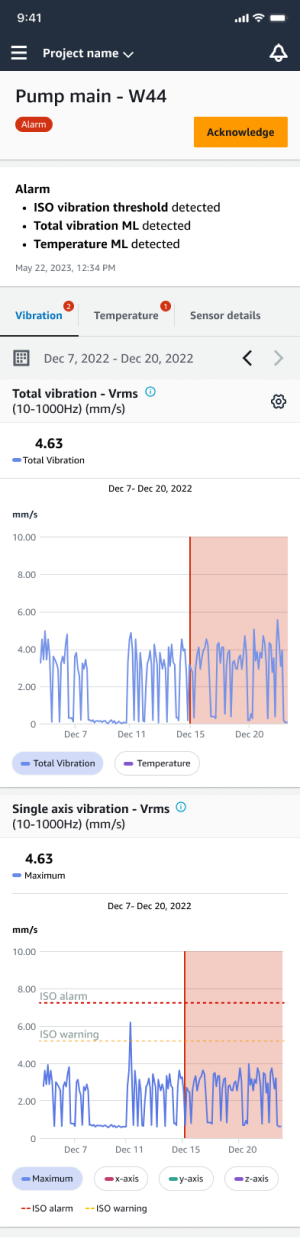
1. Under the **Vibration and Temperature** tabs, choose the chart of recent sensor data and the level of detail that you want to see.
You can choose separate versions for different time periods (1 day, 1 week, 2 weeks, 1 month, and so on).