Zoom in on a line graph or stacked area graph
In the CloudWatch console, you can use the mini-map zoom feature to focus on sections of line
graphs and stacked area graphs without changing between zoomed-in and zoomed-out views. For
example, you can use the mini-map zoom feature to focus on a peak in a line graph, so that
you can compare the spike against other metrics in your dashboard from the same timeline.
The procedures in this section describe how to use the zoom feature.
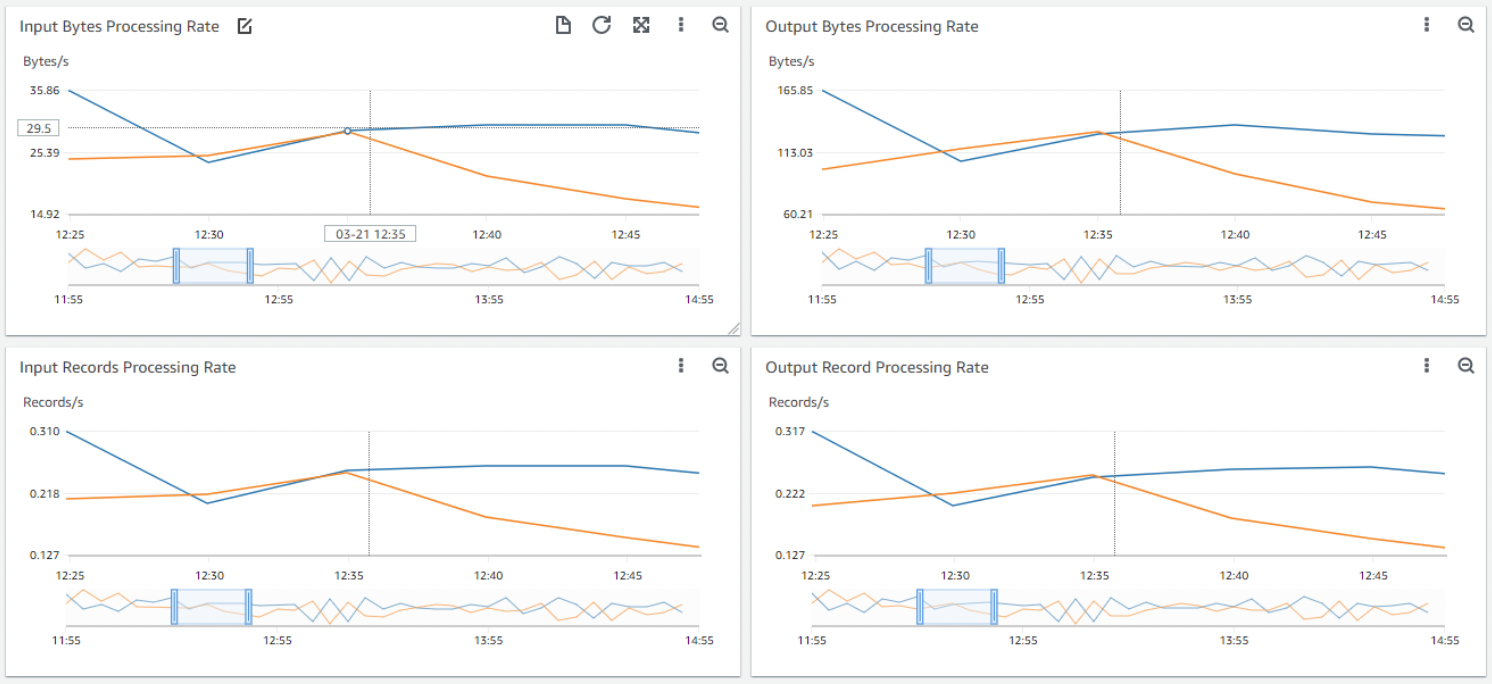
In the preceding image, the zoom feature focuses on a spike in a line graph that's
related to the input bytes processing rate while also showing other line graphs in the
dashboard that focus on sections from the same timeline.
- New interface
-
To zoom in on a graph
-
Open the CloudWatch console at
https://console.aws.amazon.com/cloudwatch/.
-
In the navigation pane, choose Metrics, and then choose
All metrics.
-
Choose Browse, and then select a metric or metrics to
graph.
-
Choose Options, and select Line
under Widget type.
-
Choose and drag on the area of the graph that you want to focus on, and then
release the drag.
-
To reset the zoom, choose the Reset zoom icon, which
looks like a magnifying glass with a minus (-) symbol inside.
- Original interface
-
To zoom in on a graph
-
Open the CloudWatch console at
https://console.aws.amazon.com/cloudwatch/.
-
In the navigation pane, choose Metrics, and then choose
All metrics. .
-
Choose All metrics, and then select a metric to graph.
-
Choose Graph options. Under Widget
type select Line.
-
Choose and drag on the area of the graph that you want to focus on, and then
release the drag.
-
To reset the zoom, choose the Reset zoom icon, which
looks like a magnifying glass with a minus (-) symbol inside.
If you already created a dashboard that contains a line graph or stacked area graph,
you can go to the dashboard and begin using the zoom feature.