Model Invocations
CloudWatch generative AI observability allows you to monitor Model Invocations performance. You can track metrics such as invocation count, token usage, and errors using out-of-box views. For detailed visibility into invocation content, such as inputs and outputs, enable Bedrock Invocation logging and send the logs to CloudWatch. For more information, see Set up a CloudWatch Logs destination and Help protect sensitive log data with masking .
Enabling model invocation in Amazon Bedrock
Note
You must enable Model invocation logging in Amazon Bedrock to view the invocations.
To enable model invocation logging in Amazon Bedrock, follow these steps.
-
Open the Amazon Bedrock console at https://console.aws.amazon.com/bedrock/
. -
Choose Settings.
-
Under Model invocation logging, select Model invocation logging.
-
Choose the required data types to include in the logs. Choose to send the logs to CloudWatch Logs only or both Amazon S3 and CloudWatch Logs if you are already publishing to Amazon S3.
-
Under the CloudWatch Logs configurations, create log group name and select the appropriate service roles.
-
Choose the required data types to include in the logs.
-
Choose Save settings
You can view the pre-configured dashboards automatically when you start using Amazon Bedrock invocations. After enabling
Model Invocation
                        logging
, you can view the default dashboards and access the invocation table below them.
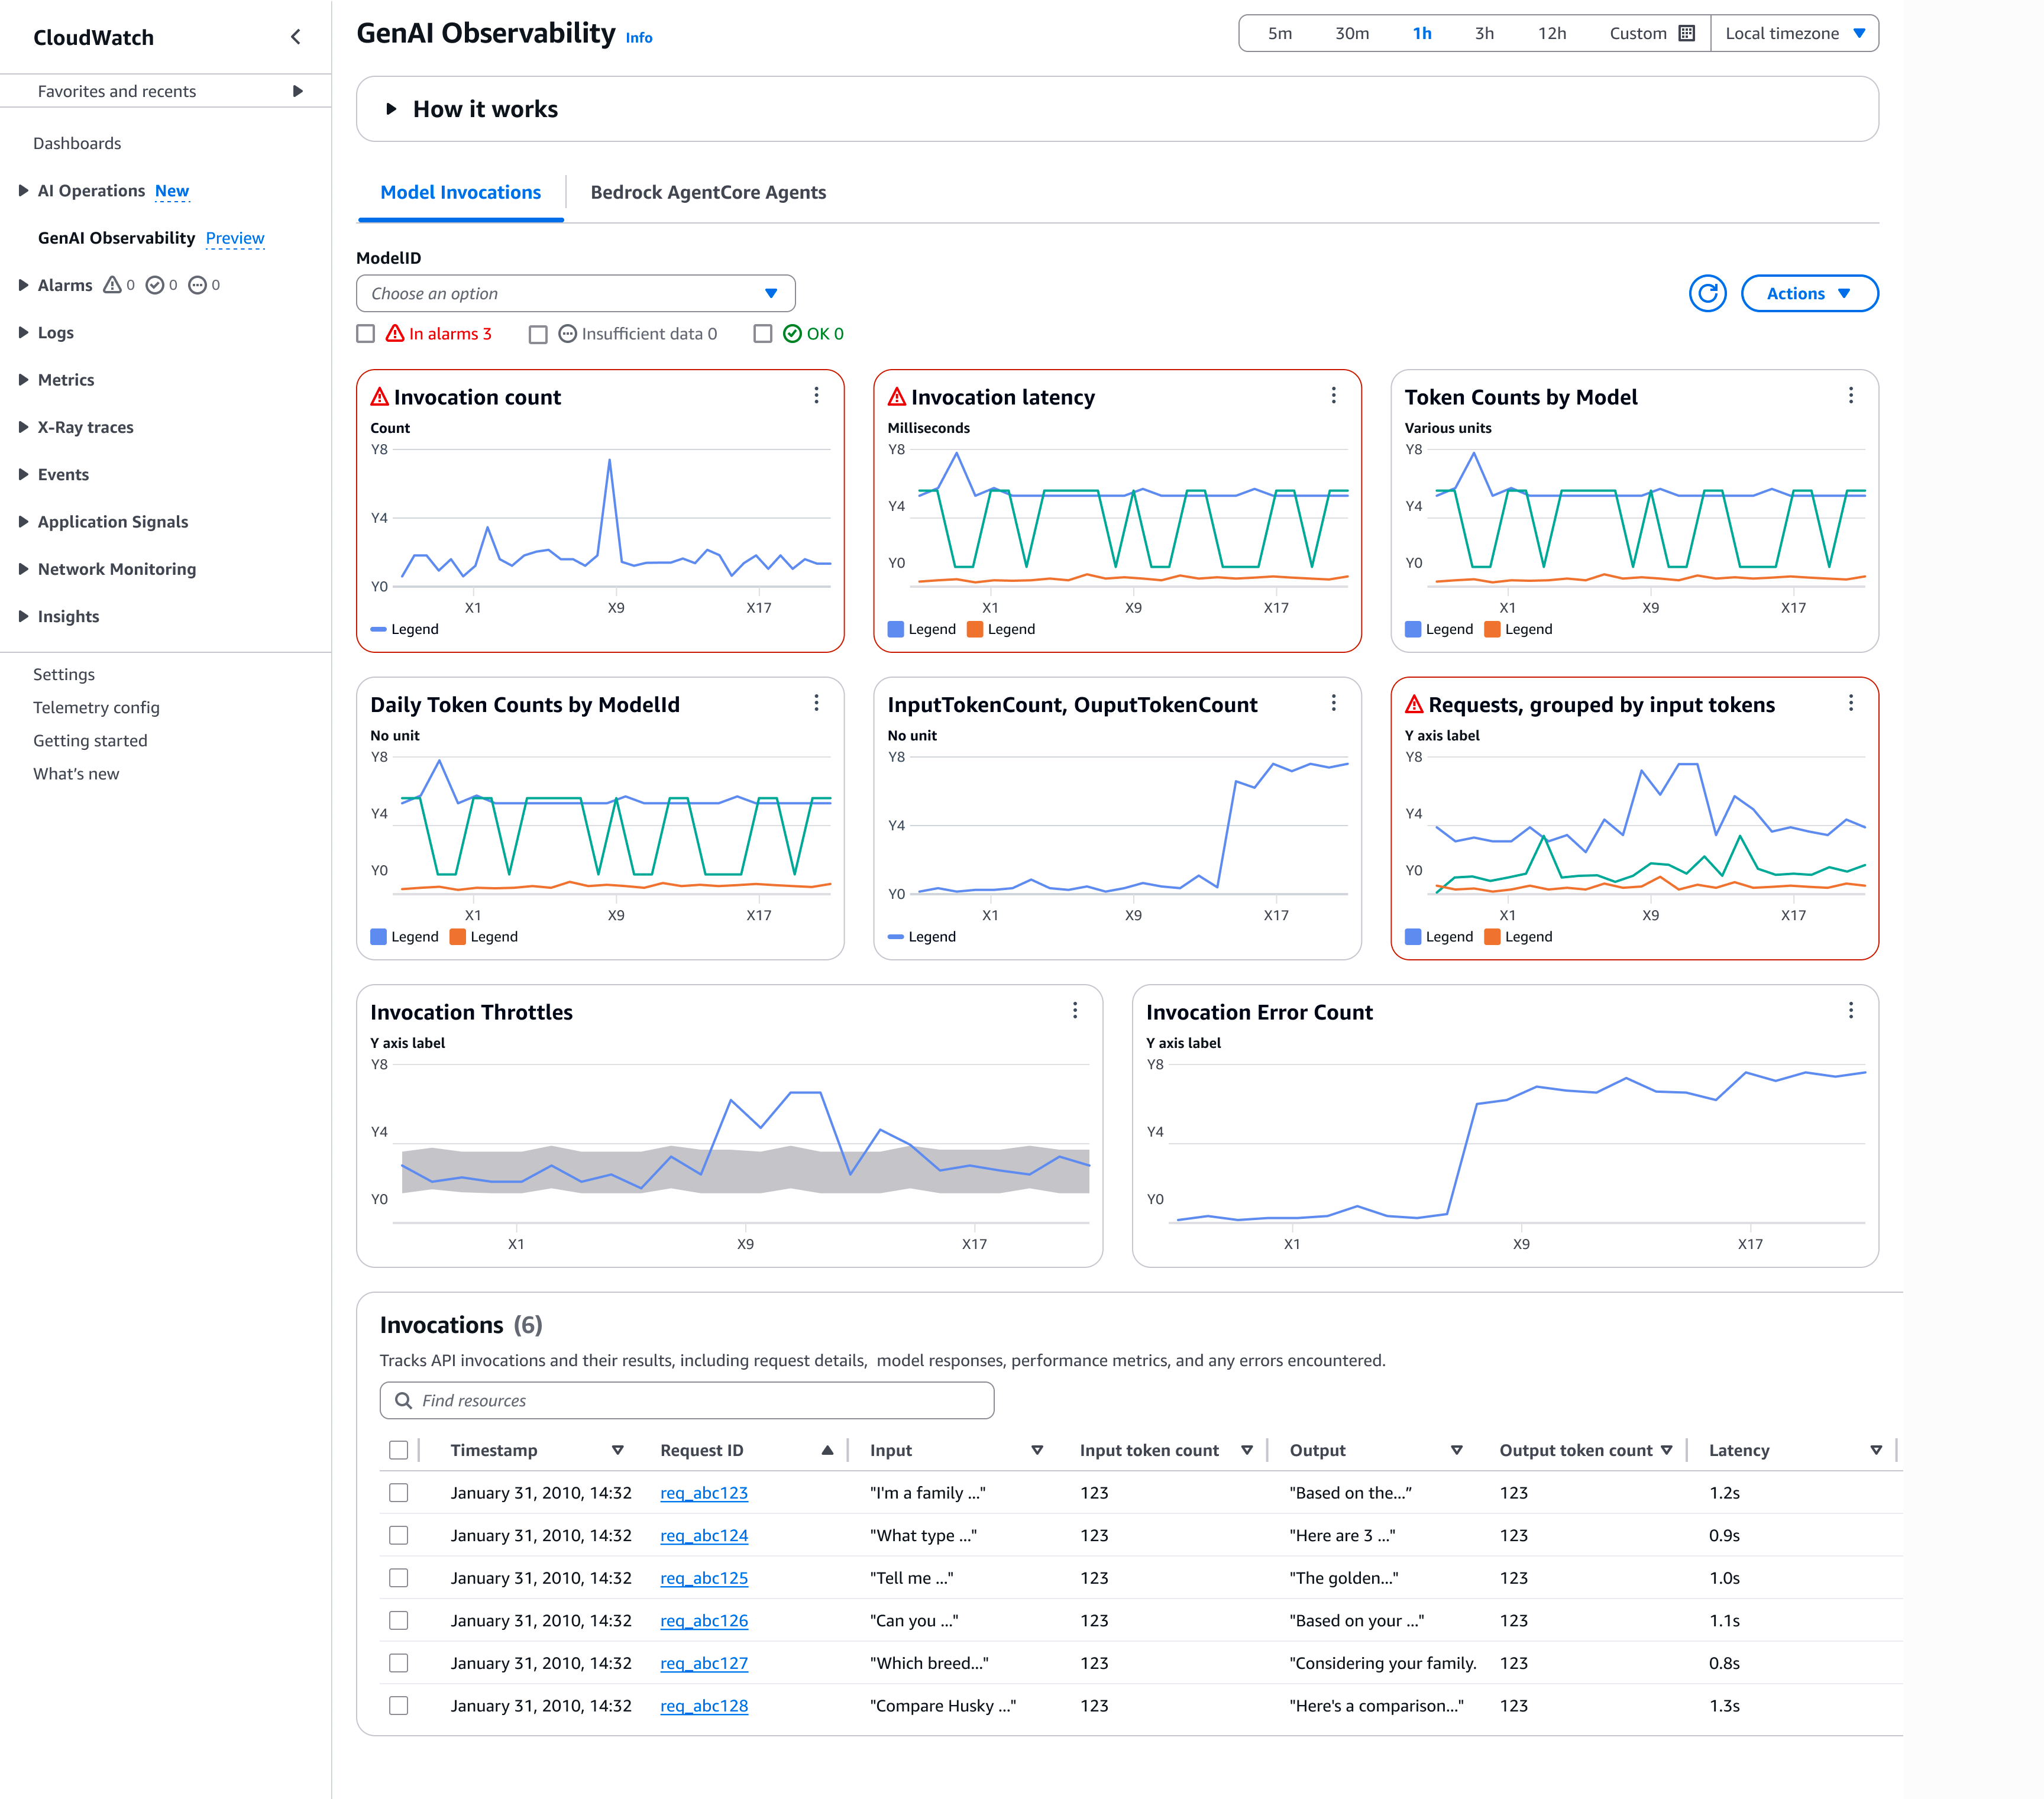
-
Invocation count – Number of successful requests to the Converse, ConverseStream, InvokeModel, and InvokeModelWithResponseStream API operations
-
Invocation latency – Latency of the invocations
-
Token Counts by Model – Token counts by model delineated by input token counts and output token counts
-
Daily Token Counts by ModelID – Daily total token counts by model ID
-
InputTokenCount, OutputTokenCount – Total number of tokens in the input and output in this account across selected models
-
Requests, grouped by input tokens – Number of requests grouped by input tokens into 6 ranges. Each line represent the number of requests that fall into a particular range
-
Invocation Throttles – Number of invocations the system throttled. The number of throttles you see will depend on your retry settings in the SDK. For more information, see Retry behavior in the AWS SDKs and Tools Reference Guide
-
Invocation Error Count – Count of invocations that result in server-side and client-side errors
To use the model invocation dashboard, follow these steps.
-
Hover over any metric graph to view invocation details. You can choose the Alarm icon to setup
Alarmsto monitor application quality and performance. -
Under the ModelID drop-down, you can select a model ID to view the corresponding metrics.
-
Select View in CloudWatch metrics to view the dashboard metrics under CloudWatch.
-
Select Period override to adjust the metrics timeframe (for example, 1 minute, 1 hour, or 6 hours).
-
Under Invocations, choose Request ID to view the details of the request. You can view the model invocation input and output details on the right-pane.

On the Request ID page, under Actions drop-down, choose View in Logs Insights to view the logs in CloudWatch. For more information, see Analyzing log data with CloudWatch Logs Insights.
