Agent view
The Agent view provides a curated dashboard for your account's agents. You can view data from agents hosted on AWS native services like AgentCore Runtime, Lambda, or Amazon EC2. The view also displays agents that emit telemetry to CloudWatch.
Overview
The metrics and dashboards show data from sampled agent spans. For information about agent spans, see Spans.
The following Agent metrics are supported:
-
Agents/Endpoints – Number of agents and aliases instrumented and emitting spans
-
Sessions – Number of sessions created by instrumented agents emitting spans. A session is similar to a conversation and contains the broad context
-
Traces – Number of traces created by instrumented agents emitting spans. A trace is a individual request-response cycle within a session
-
Error rate – Percentage of errors in agent interactions
-
Throttle rate – Percentage of throttled agent interactions
Choose View details to see the Agent metrics in graphs.

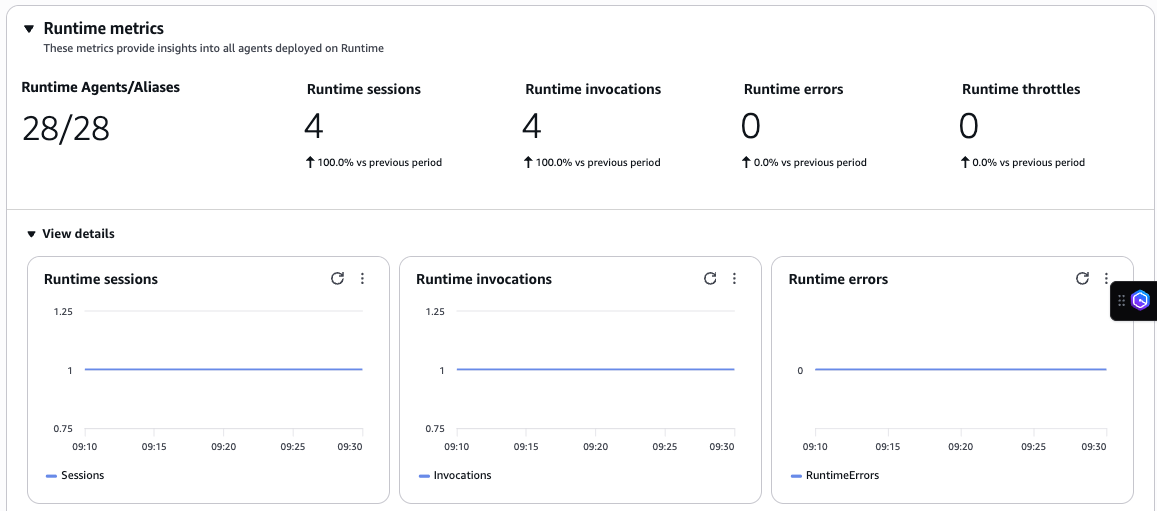
Runtime metrics
The Runtime metrics and dashboards display data from the Runtime primitive. Using this primitive, you can host your agents on the Amazon Bedrock AgentCore runtime. For more information, see Creating an AgentCore Runtime .
AgentCore Runtime supports these metrics
-
Runtime Agents/Aliases – Tracks number of agents and aliases hosted on AgentCore Runtime
-
Runtime sessions – Tracks number of sessions created by agents running in AgentCore Runtime. A session is similar to a conversation and contains the broad context of the entire interaction flow. Useful for monitoring overall platform usage, capacity planning, and understanding user engagement patterns
-
Runtime invocations – Total number of requests made to the Data Plane API. Each API call counts as one invocation, regardless of the request payload size or response status
-
Runtime errors – The number of system and user errors. For system and user error definitions, see AgentCore provided runtime metrics
-
Runtime throttles – The number of requests throttled by the service due to exceeding allowed TPS (Transactions Per Second). These requests return ThrottlingException with HTTP status code 429. Monitor this metric to determine if you need to review your service quotas or optimize request patterns
View metric changes over time in the default dashboard. Expand View details to display metric graphs.
Agents
Agents are components that collect and send monitoring data from your applications. The Agents table displays all agents configured in your account. These agents can be hosted on AWS native services like AgentCore Runtime, Lambda, or Amazon EC2. The table also displays other agents that are instrumented to emit telemetry to CloudWatch.
You can use Filter agents to find a specific agent that you want to deep dive or you can also use the column names to sort the agents to find the required agent. Select the gear icon to show or hide additional columns.

You can view the details of the Agent by expanding the agent name.
Agent details- Overview
The Overview tab displays automatic dashboards for your agent metrics. These metrics come from sampled spans and Runtime metrics (when the agent uses AgentCore Runtime).
The Evaluators dashboard includes insights derived from spans with evaluations enabled.
-
Top deltas in evaluator scores — Shows the agent evaluators that experienced the most change since the last period based on the time period you selected.
-
Evaluation configuration metrics — Show the operational status metrics for the agent evaluators, including the number of times the evaluations were executed and the number of errors encountered.
To edit an evaluation configuration using the Amazon Bedrock AgentCore console, click the link in the Evaluator or Evaluation configuration column. To review the evaluator results, click a score in the Avg. score column. To view all evaluations for the agent, choose the Evaluations tab. For more information, see Agent details - Evaluations.
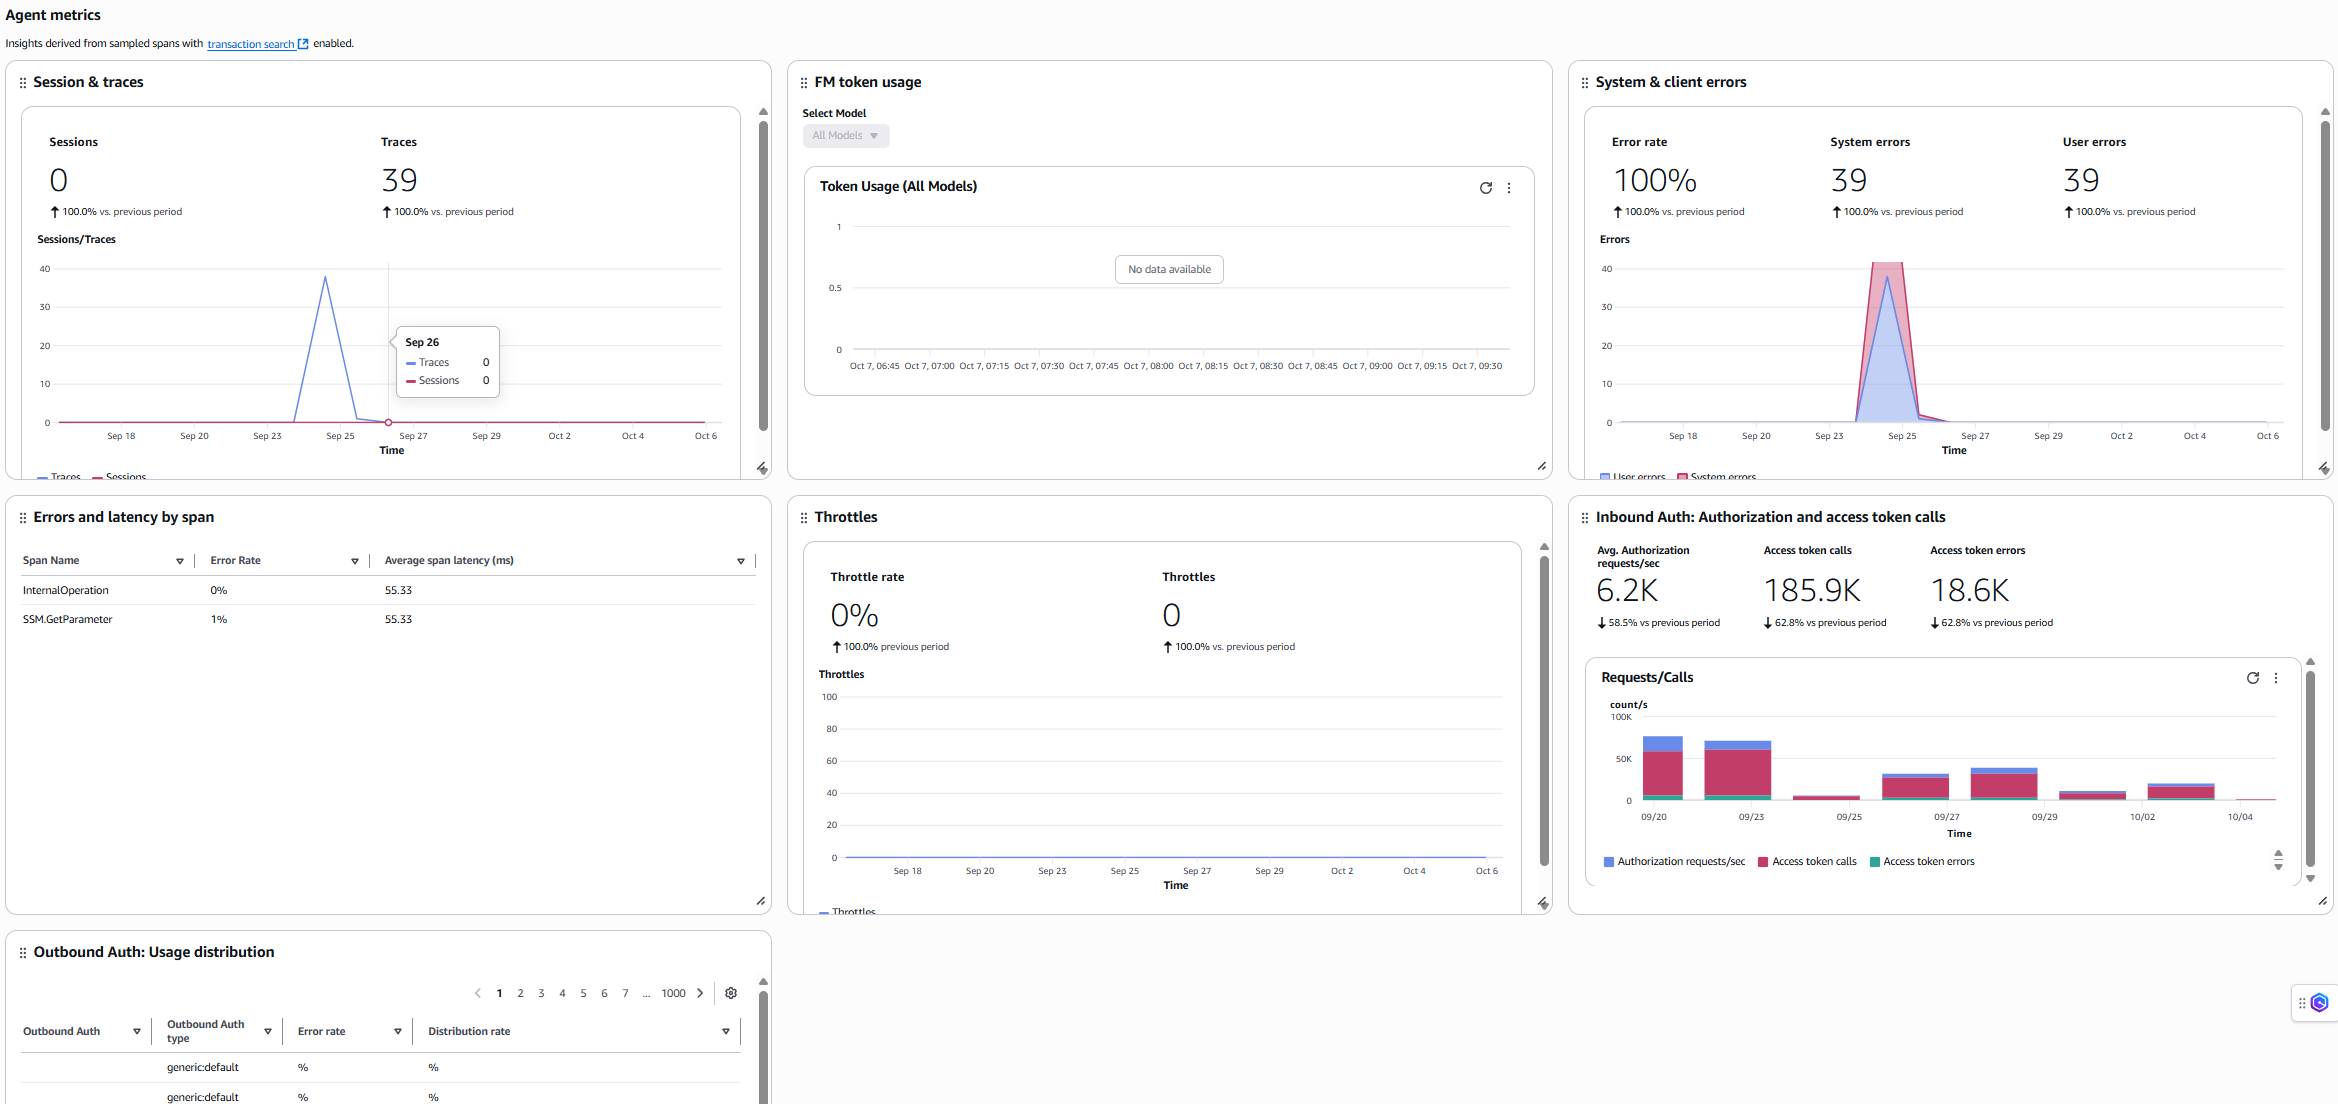
The Agent metrics dashboard include metrics which are derived from sampled spans:
-
Sessions and Traces – Count of sessions and traces for this agent
-
FM token usage – Total count of Foundational Model token consumption. You can filter the chart into a particular Foundational Model
-
System and client errors – Count of system errors during request processing. High levels of server-side errors can indicate potential infrastructure or service issues that require investigation. Client errors are errors resulting from invalid requests. High levels of client-side errors can indicate issues with request formatting or permissions
-
Errors and latency by span – The error rates and latency by a particular span. Note that a span can appear in many agents
-
Throttles – Number of requests throttled by the service due to exceeding allowed TPS (Transactions Per Second)
-
Inbound Auth:Authorization and access token calls – Number of incoming authentication requests processed by the agent, including authorization checks and access token validations from external clients or services
-
Outbound Auth:Usage distribution – Distribution pattern of outbound authentication methods used by the agent, showing the frequency and types of authentication mechanisms employed when accessing external services
The Runtime metrics dashboard includes metrics that AgentCore Runtime automatically generates:
-
Runtime sessions and invocations – Count of sessions and invocations that this particular agent has generated while being hosted on Runtime
-
Runtime latency – Latency of requests by agents hosted on Runtime
-
Runtime throttles – Number of requests throttle by the service due to exceeding allowed TPS (Transactions Per Second)
