View overall service activity and operational health with the Services page
Use the Services page to see a list of your services that are enabled for Application Signals. You can also view
operational metrics and quickly see which services have unhealthy service level indicators (SLIs). Drill down to
look for performance anomalies as you identify the root cause of operational issues. To view this page, open the
CloudWatch console
For un-instrumented services, the Service overview page displays limited information with prominent calls-to-action to enable Application Signals instrumentation.
Explore operational health metrics for your services
The top of the Services page includes an overall service operational health graph and several tables displaying top services and service dependencies by fault rate and list of services. The Services graph on the left displays a breakdown of the number of services that have healthy or unhealthy service level indicators (SLIs) during the current page-level time filter. SLIs can monitor latency, availability, and other operational metrics. View the top services by fault rate in the two tables next to the graph. Select a service name in either table to open its service detail page page, which displays detailed service operation information. Select a dependency path to view service dependency details on its detail page.
Both tables display information for up to the past three hours, even if a longer time period filter is chosen at the top right of the page.
When using dynamic service grouping, the operational health metrics automatically aggregates data across all services within each group. This provides:
Consolidated fault rates for service groups
Group-level SLI health status
Aggregated performance metrics that help identify problematic service clusters
Quick identification of which groups require immediate attention during incidents

Monitor operational health with the Services table
The Services table displays a list of your services that have been enabled for Application Signals. Choose Enable Application Signals to open a setup page and start configuring your services. For more information, see Enable Application Signals.
Filter the Services table to make it easier to find what you're looking for, by choosing one or more properties from the filter text box. As you choose each property, you are guided through filter criteria. You will see the complete filter below the filter text box. Choose Clear filters at any time to remove the table filter.
The advanced filtering options allows you to:
Filter by service groups (both default and custom groupings)
Filter by recent deployment activity
Filter by Platform
Filter by SLI Health
Filter by Account ID (in cross-account observability setups)
Filter by instrumentation status (instrumented vs un-instrumented)
Filter by environment
Filter by service health status
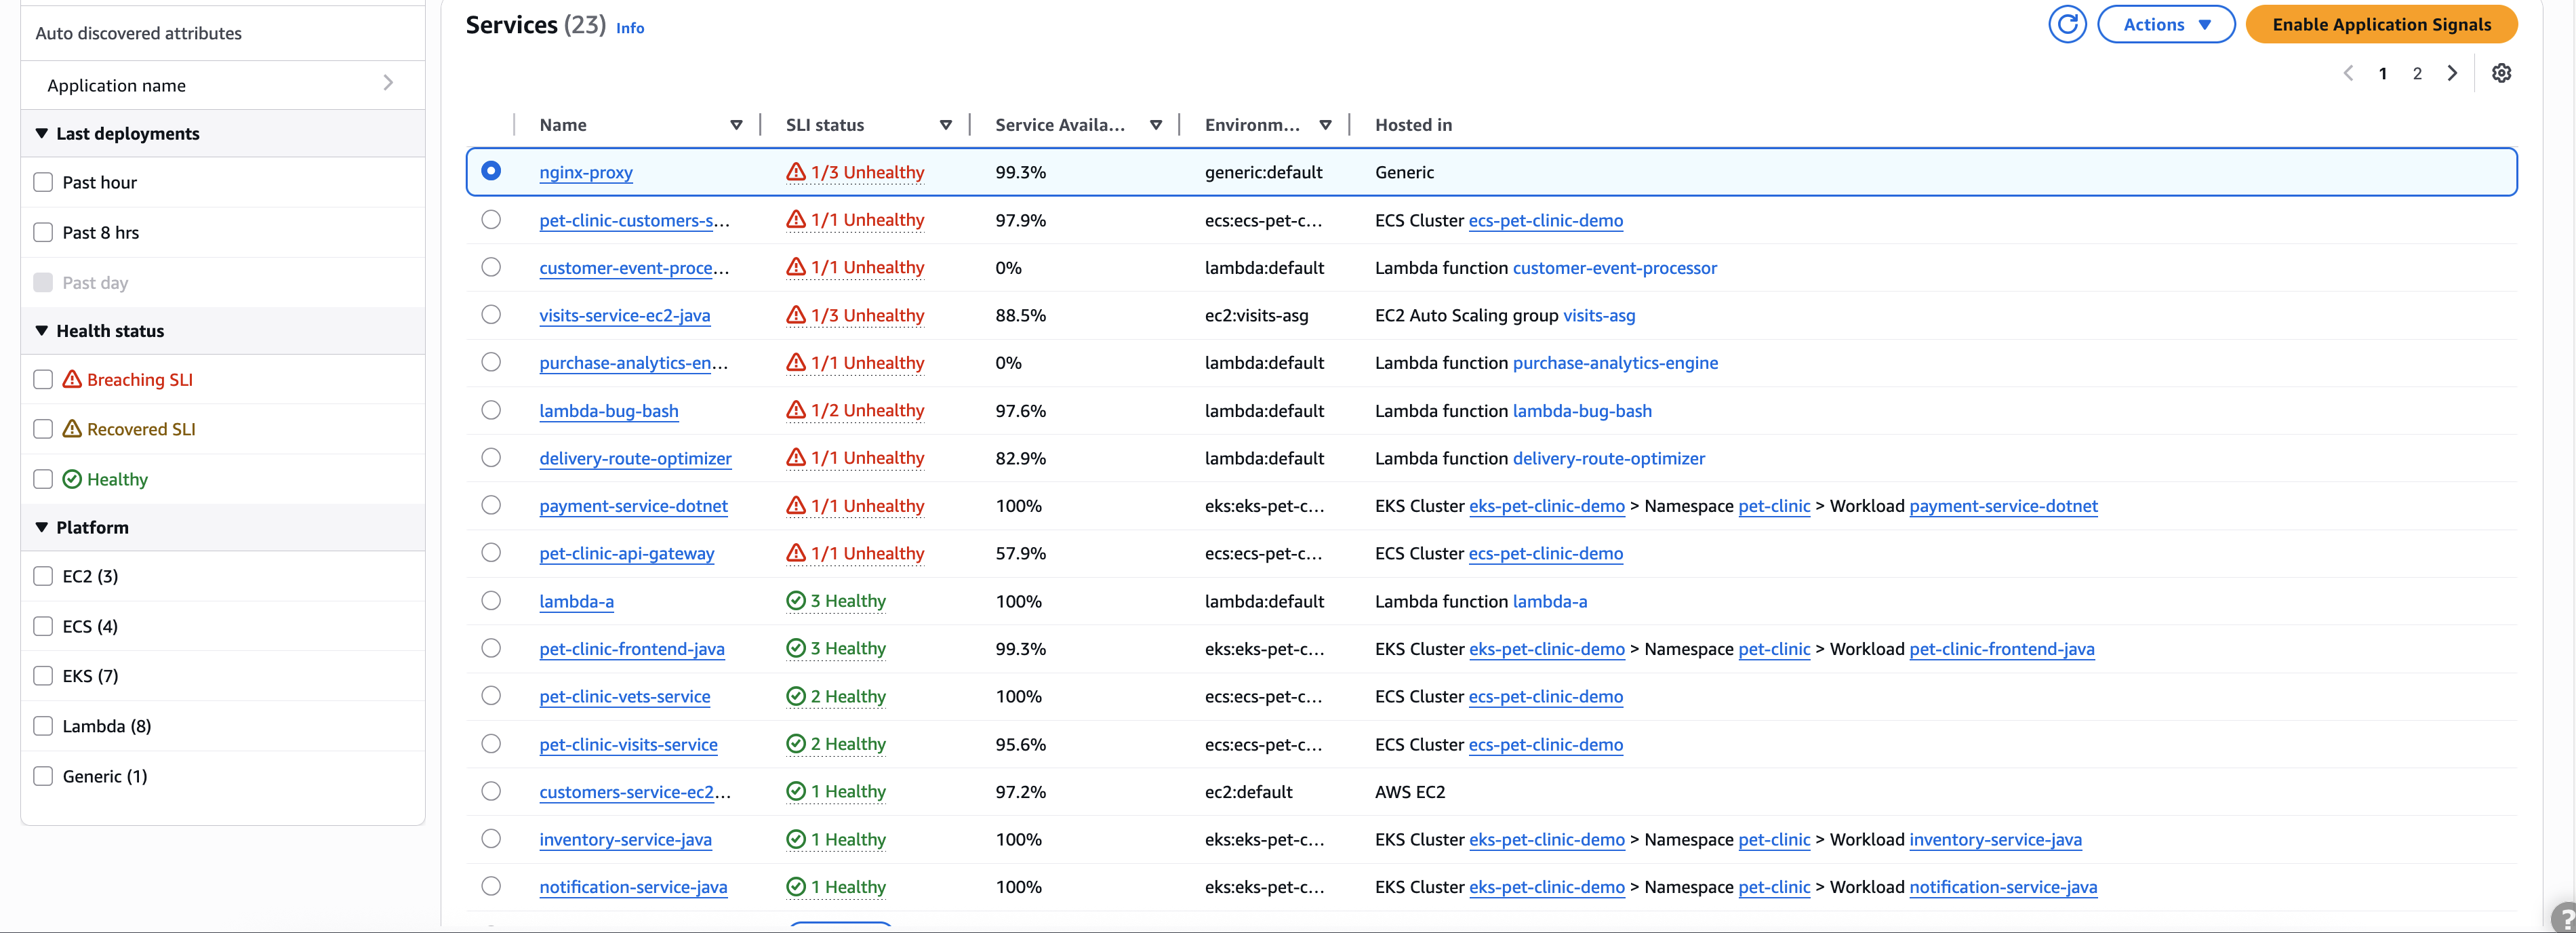
For un-instrumented services, the Service overview page displays limited information with prominent calls-to-action to enable Application Signals instrumentation. Un-instrumented services appear in the Services table even when they haven't been configured with Application Signals, helping you identify gaps in your observability coverage and prioritize which services to instrument next based on their position in your architecture.
Choose the name of any service in the table to view a service detail page containing service-level metrics, operations, and additional details. If you have associated the service's underlying compute resource with an application in AppRegistry or the Applications card on the AWS Management Console home page, choose the application name to display the application details in the myApplications console page. For services hosted in Amazon EKS, choose any link within the Hosted in column to view Cluster, Namespace, or Workload within CloudWatch Container Insights. For services running on Amazon ECS or Amazon EC2, the Environment value is shown.
Service level indicator (SLI) status is displayed for each service in the table. Choose the SLI status for a service to display a pop-up containing a link to any unhealthy SLIs, and a link to see all SLOs for the service.

If no SLOs have been created for a service, choose the Create SLO button within the SLI Status column. To create additional SLOs for any service, select the option button next to the service name, and then choose Create SLO at the top-right of the table. When you create SLOs, you can see at a glance which of your services and operations are performing well and which are unhealthy. See service level objectives (SLOs) for more information.
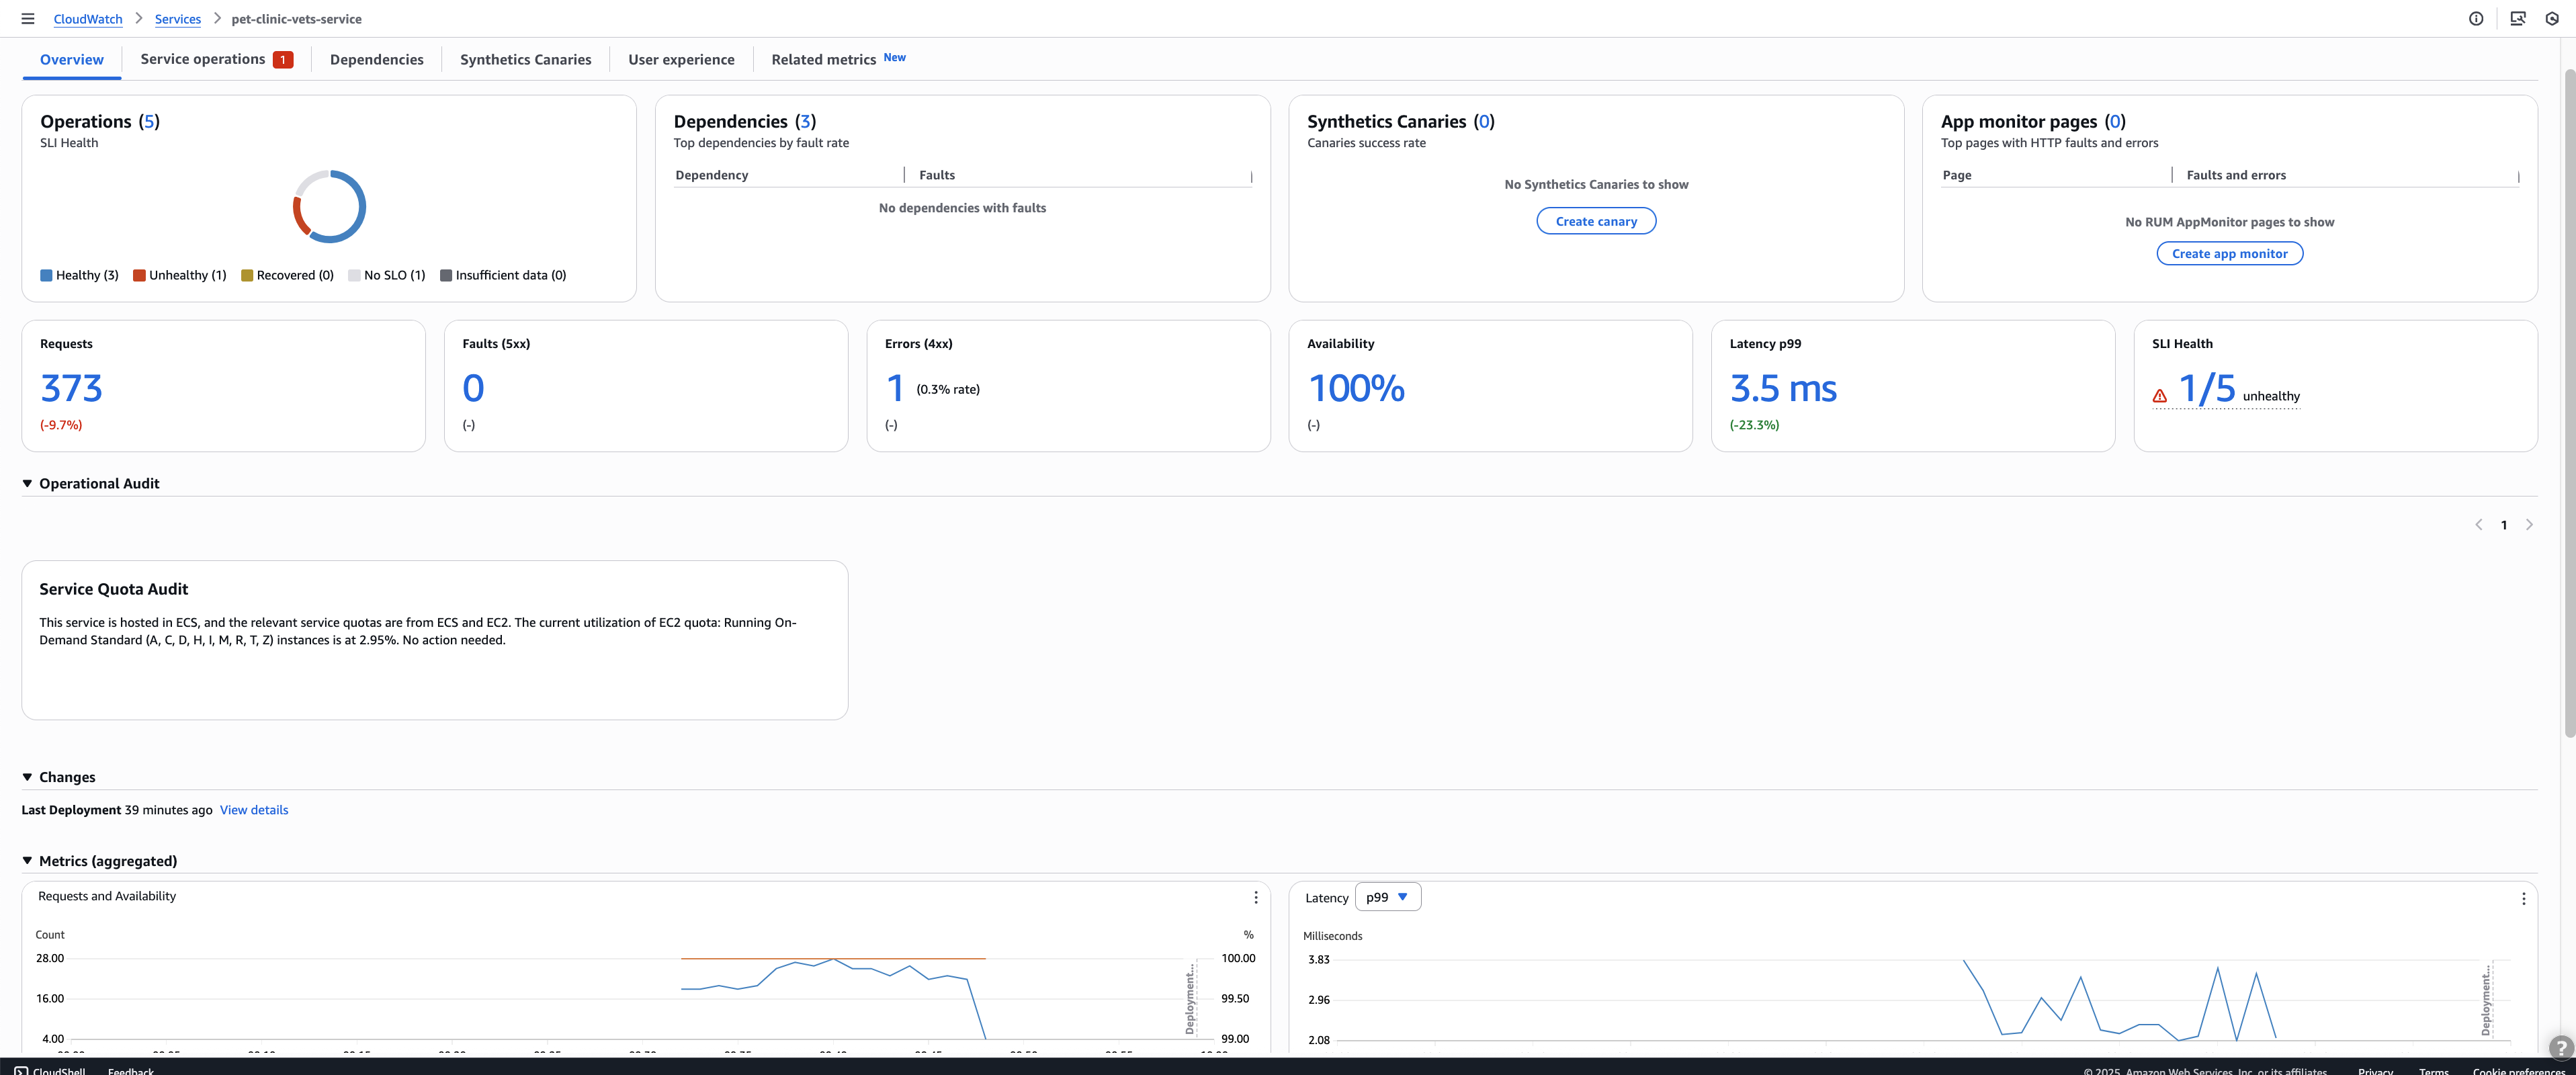
Service overview
After you select a service from the Services table, the Service overview page opens. This page provides a comprehensive view of your service's operational health and performance metrics. The overview displays these summary metrics:
Total operations
Service dependencies
Canary monitoring status
RUM client data
These metrics give you immediate insight into your service's current state.
You can visualize key operational performance indicators over time using a series of charts. To analyze trends and identify potential issues affecting your service health, adjust the time filter. All charts automatically update to reflect data for the selected time period.
The Audit findings section automatically detects and shows critical problems in your service's behavior, so you don't need to investigate manually. Application Signals analyzes your applications to report significant observations and potential problems, simplifying root cause analysis. These automated findings consolidate relevant traces, eliminating the need to navigate through multiple clicks. The audit system helps teams quickly identify issues and their underlying causes, enabling faster problem resolution.
You can use the Change events section to identify how recent deployments or configuration changes affect your service behavior. Application Signals automatically processes CloudTrail events to track change events across your application. Monitor configuration and deployment events for services and their dependencies, providing immediate context for operational analysis and troubleshooting. Application Signals automatically correlates deployment times with performance changes, helping you quickly identify if recent deployments contributed to service issues.