Built-in tools
Use CloudWatch to gain visibility into how your agents use built-in tools like Code interpreter tool and Browser use tool to complete tasks. CloudWatch provides monitoring capabilities for each tool.
For more information on Amazon Bedrock AgentCore built-in tools, see Use Amazon Bedrock AgentCore built-in tools to interact with your applications
.
Code interpreter tool
You can use the code interpreter tool for the following:
-
Track code execution success rates, runtime duration, and resource consumption
-
Monitor memory usage and computational resource allocation
-
Analyze code execution patterns and optimization opportunities
-
Observe error rates and debugging information for failed executions
-
Track security sandbox isolation and compliance metrics
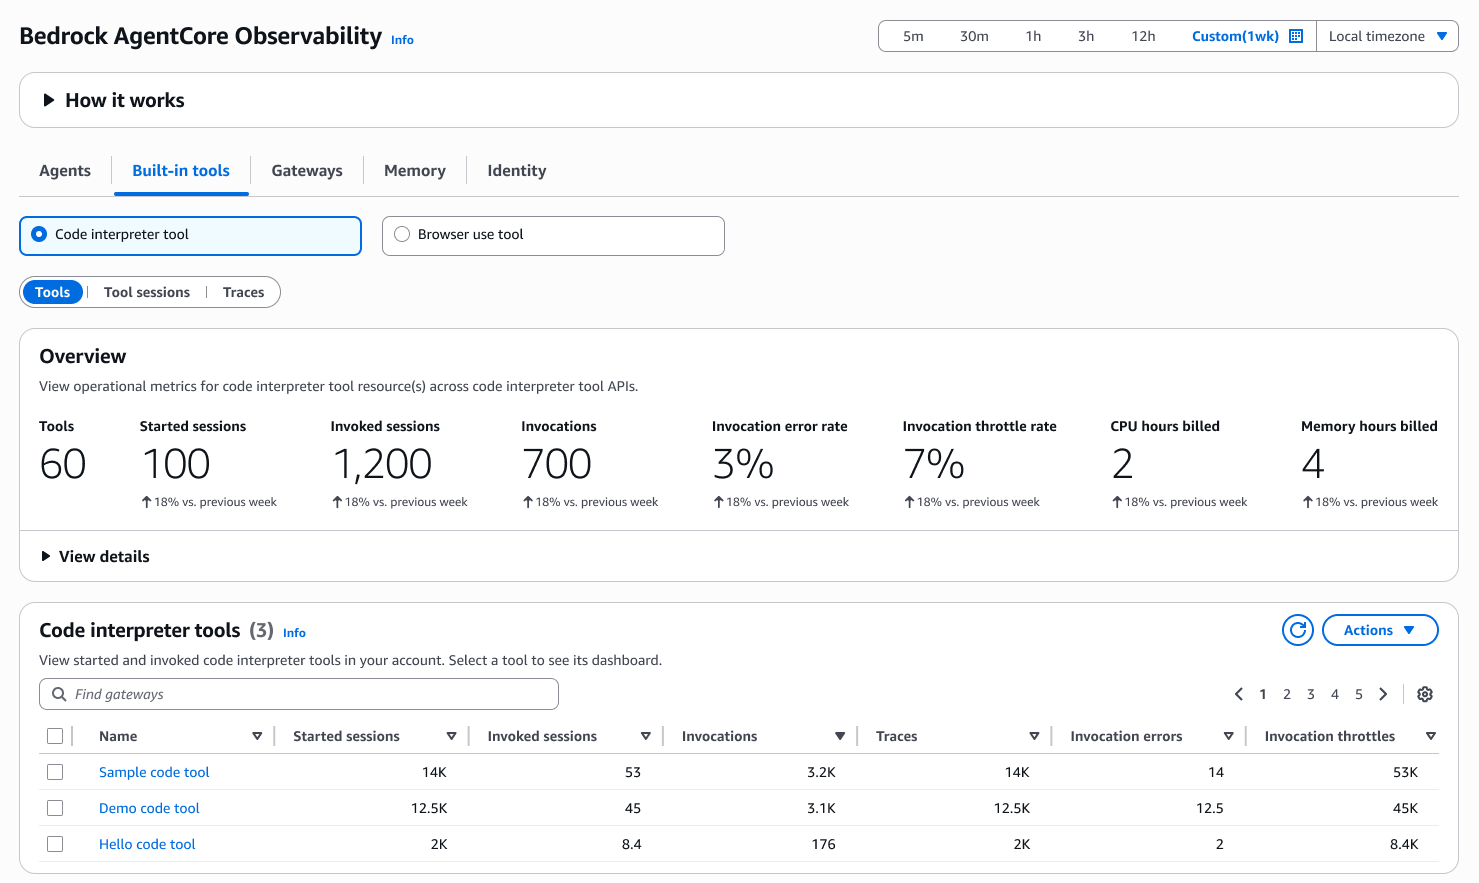
Tools – You can monitor fetch operations and API calls made through the browser tool. Choose a tool under Name to view the dashboard.
Choose View details to view the resource details.
Started sessions – Total number of code interpreter sessions initiated by agents. Each session represents a sandboxed environment where agents can execute code, analyze data, and generate outputs. Monitor this metric to track code interpreter usage and capacity planning
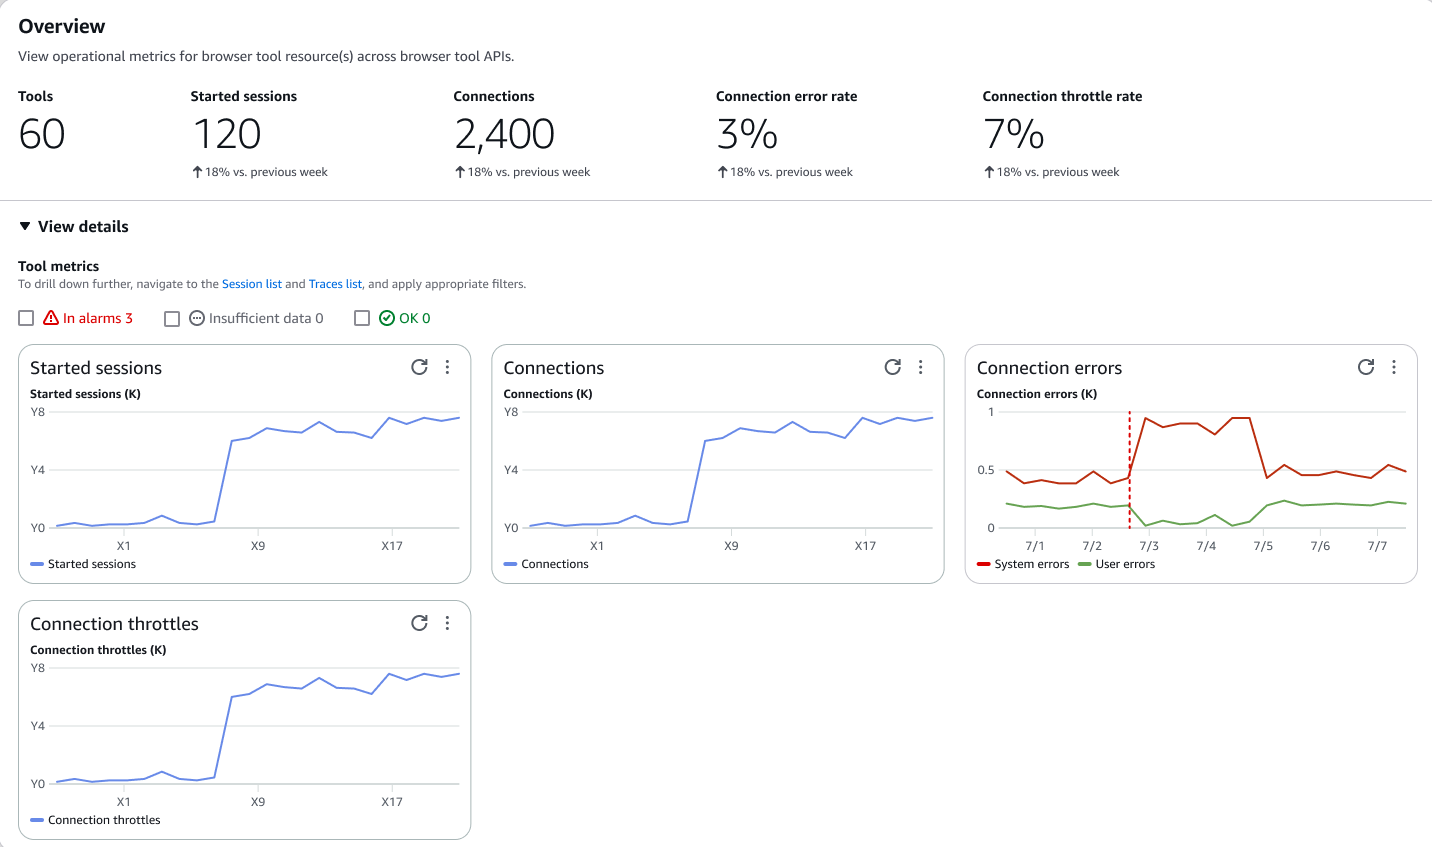
Connections – Number of active connections to code interpreter runtime environments. This includes both successful connections and connection attempts, helping track resource utilization and concurrent usage patterns
Connection errors – Count of failed connections to code interpreter environments due to system issues, resource constraints, or configuration problems. High connection error rates may indicate infrastructure issues requiring investigation
Connection throttles – Number of connection requests throttled due to exceeding allowed limits or resource constraints. Monitor this metric to identify when code interpreter usage approaches capacity limits and may require scaling
CPU hours billed – Total computational time consumed by code interpreter sessions, measured in CPU hours. This metric helps track resource costs and optimize code execution efficiency across agent workloads
Memory hours billed – Total memory consumption by code interpreter sessions over time, measured in memory hours. Use this metric for cost tracking and to identify memory-intensive code execution patterns that may need optimization
Tool sessions – View all the connected sessions where the tool was used.
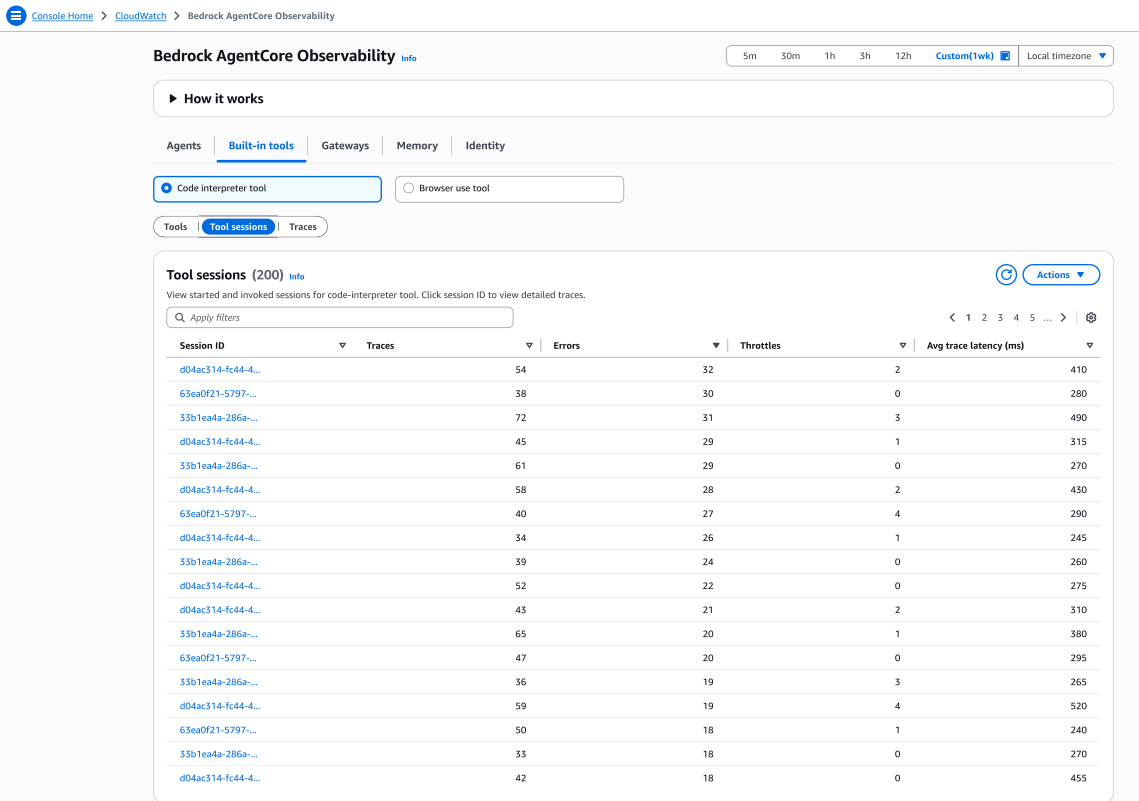
Choose a Session ID under Total sessions to view the session dashboard.
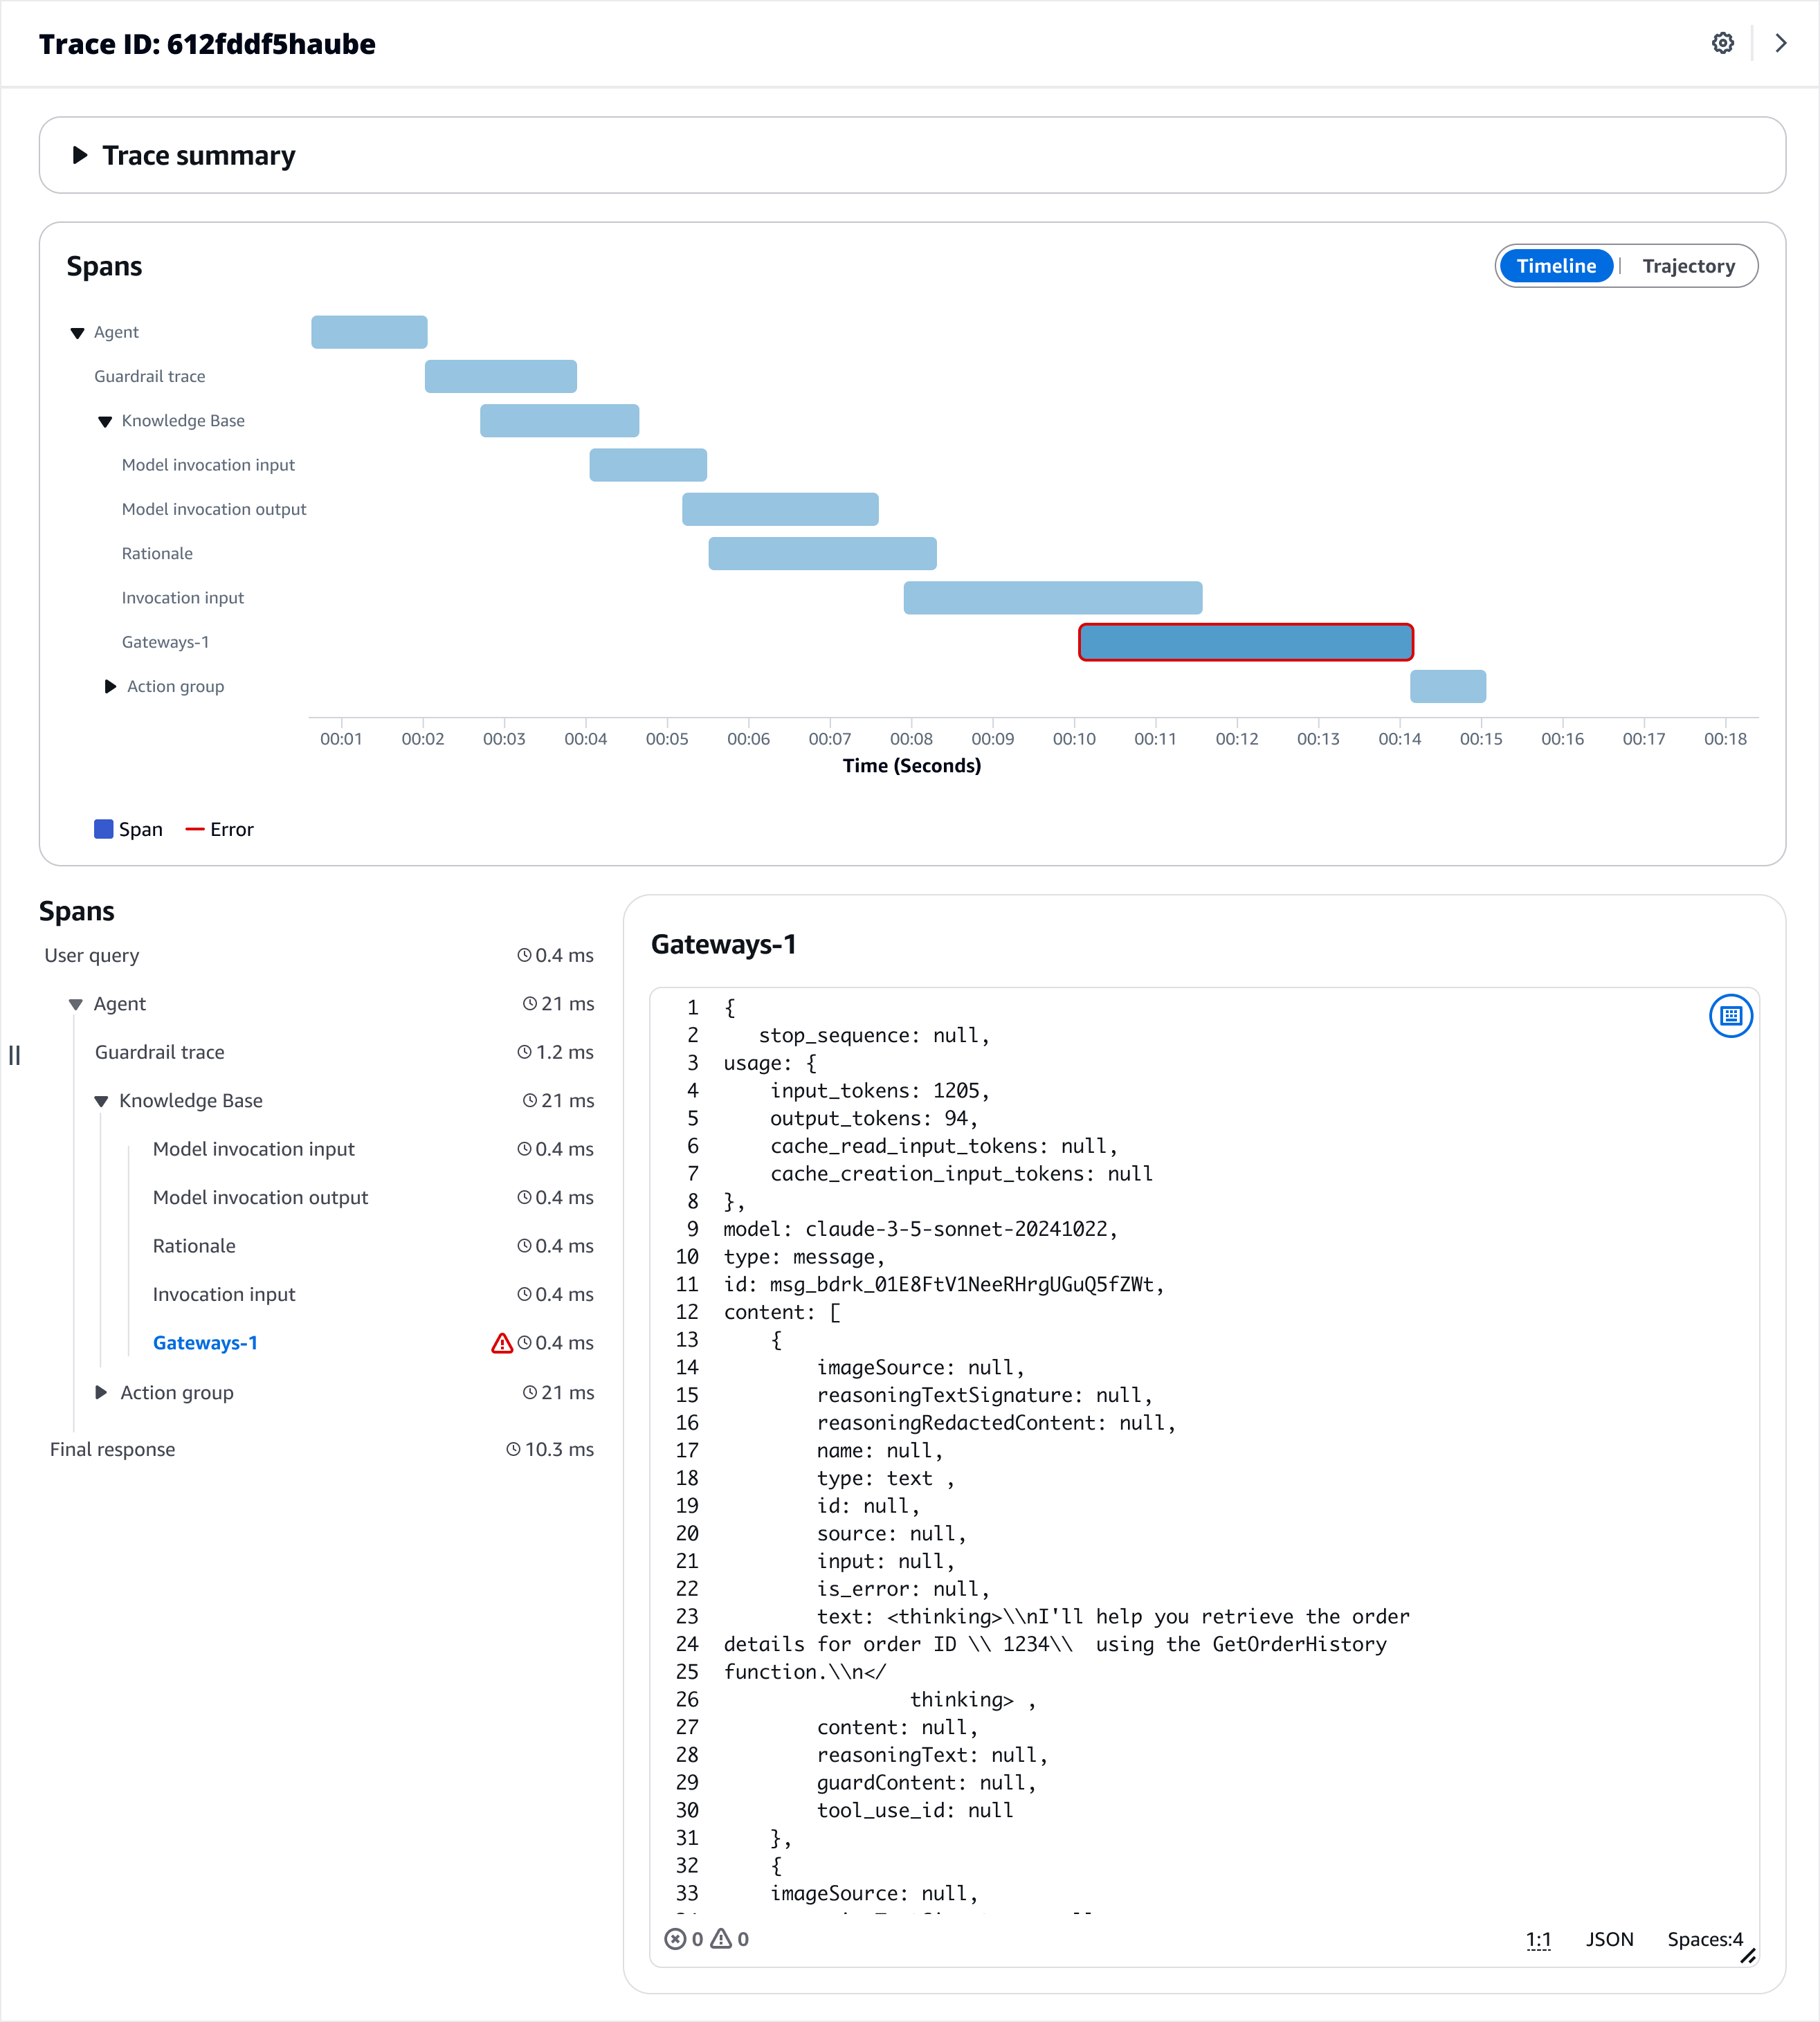
Traces – View the sample traces for agents with observability enabled.
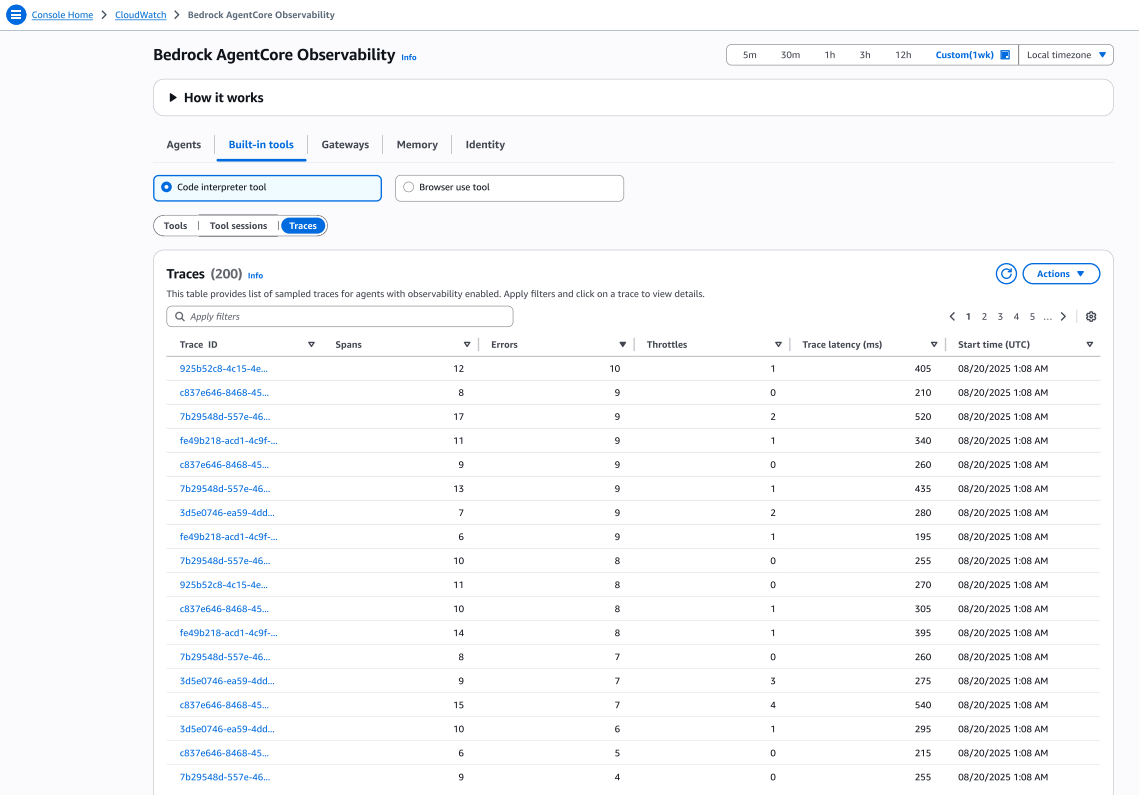
Choose a Trace ID under Traces to view the trace details.
Browser use tool
You can use the browser use tool for the following:
-
Track browser navigation patterns, page load times, and interaction success rates
-
Observe browser session duration and resource utilization
-
Analyze fetch errors and troubleshoot browser automation issues
-
Observe browser session duration and resource utilization
-
Track security sandbox performance and isolation effectiveness
Note
The Tools, Tool sessions, and Traces tab experience and fields are similar to Code interpreter tool. For more information on the fields, see Code interpreter tool.
